17 Comparison of TransPropy with Other Tool Packages Using Seprate All GSEA (Gene: CFD/ANKRD35/ALOXE3)
library(readr)
library(TransProR)
library(dplyr)
library(rlang)
library(linkET)
library(funkyheatmap)
library(tidyverse)
library(RColorBrewer)
library(ggalluvial)
library(tidyr)
library(tibble)
library(ggplot2)
library(ggridges)
library(GSVA)
library(fgsea)
library(clusterProfiler)
library(enrichplot)
library(MetaTrx)
library(GseaVis)
library(stringr)
17.1 CFD
17.1.1 TransPropy HALLMARKS
print(TransPropy_CFD_hallmarks_y@result$ID)

# plot
geneSetID = c("Xenobiotic Metabolism",
              "Kras Signaling Dn",
              "Myogenesis",
              "Allograft Rejection",
              "Glycolysis",
              "Spermatogenesis",
              "Mitotic Spindle",
              "E2f Targets",
              "G2m Checkpoint")

lapply(geneSetID, function(x){
  gseaNb(object = TransPropy_CFD_hallmarks_y,
          geneSetID = x,
          newGsea = T,
          addPval = T,
          pvalX = 0.02,pvalY = 0.1,
          pCol = 'black',
          pHjust = 0,
          subPlot = 2,newCurveCol = c("#00838f", "white", "#6a1b9a"),
          newHtCol = c("#6a1b9a", "white", "#00838f"))
}) -> gseaList1

# combine
cowplot::plot_grid(plotlist = gseaList1,ncol = 2,align = 'hv')![]()
TransPropy_CFD_hallmarks
17.1.1.1 Show the top one (NES) pathway gene
core <- TransPropy_CFD_hallmarks_y@result[TransPropy_CFD_hallmarks_y@result$ID == "Xenobiotic Metabolism", "core_enrichment"]
length(core) # One vector composed of all core genes, separated by '/'
core
# Split the core into a vector of individual genes:
core_genes <- str_split(core, '/')[[1]]
core_genes
# 2.3—Mark the candidate genes of interest in the standard GSEA enrichment result plot:

gseaNb(
  object = TransPropy_CFD_hallmarks_y,
  geneSetID = "Xenobiotic Metabolism",
  subPlot = 3,
  addPval = TRUE,
  pvalX = 0.2,
  pvalY = 0,
  lineSize = 3.8,
  curveCol = rev(c("#6a1b9a", "#00838f")),
  htCol = rev(c("#6a1b9a", "#00838f")),
  rankCol = rev(c("#6a1b9a", "white", "#00838f")),
  addGene = core_genes,
  #kegg = TRUE,
  geneCol = 'grey40',
  rmSegment = TRUE # Remove red line
)![]()
TransPropy_CFD_hallmarks_y_topone (NES)
17.1.2 TransPropy KEGG
print(TransPropy_CFD_kegg_y@result$ID)

# plot
geneSetID = c("Metabolism Of Xenobiotics By Cytochrome P450",
              "Drug Metabolism Cytochrome P450",
              "Retinol Metabolism",
              "Arachidonic Acid Metabolism",
              "Calcium Signaling Pathway",
              "Ppar Signaling Pathway",
              "Vascular Smooth Muscle Contraction",
              "Glycolysis Gluconeogenesis",
              "Endocytosis",
              "Type I Diabetes Mellitus",
              "Hematopoietic Cell Lineage",
              "Graft Versus Host Disease",
              "Leishmania Infection",
              "Cell Cycle")

lapply(geneSetID, function(x){
  gseaNb(object = TransPropy_CFD_kegg_y,
          geneSetID = x,
          newGsea = T,
          addPval = T,
          pvalX = 0.02,pvalY = 0.1,
          pCol = 'black',
          pHjust = 0,
          subPlot = 2,newCurveCol = c("#00838f", "white", "#6a1b9a"),
          newHtCol = c("#6a1b9a", "white", "#00838f"))
}) -> gseaList1

# combine
cowplot::plot_grid(plotlist = gseaList1,ncol = 2,align = 'hv')
![]()
TransPropy_CFD_kegg
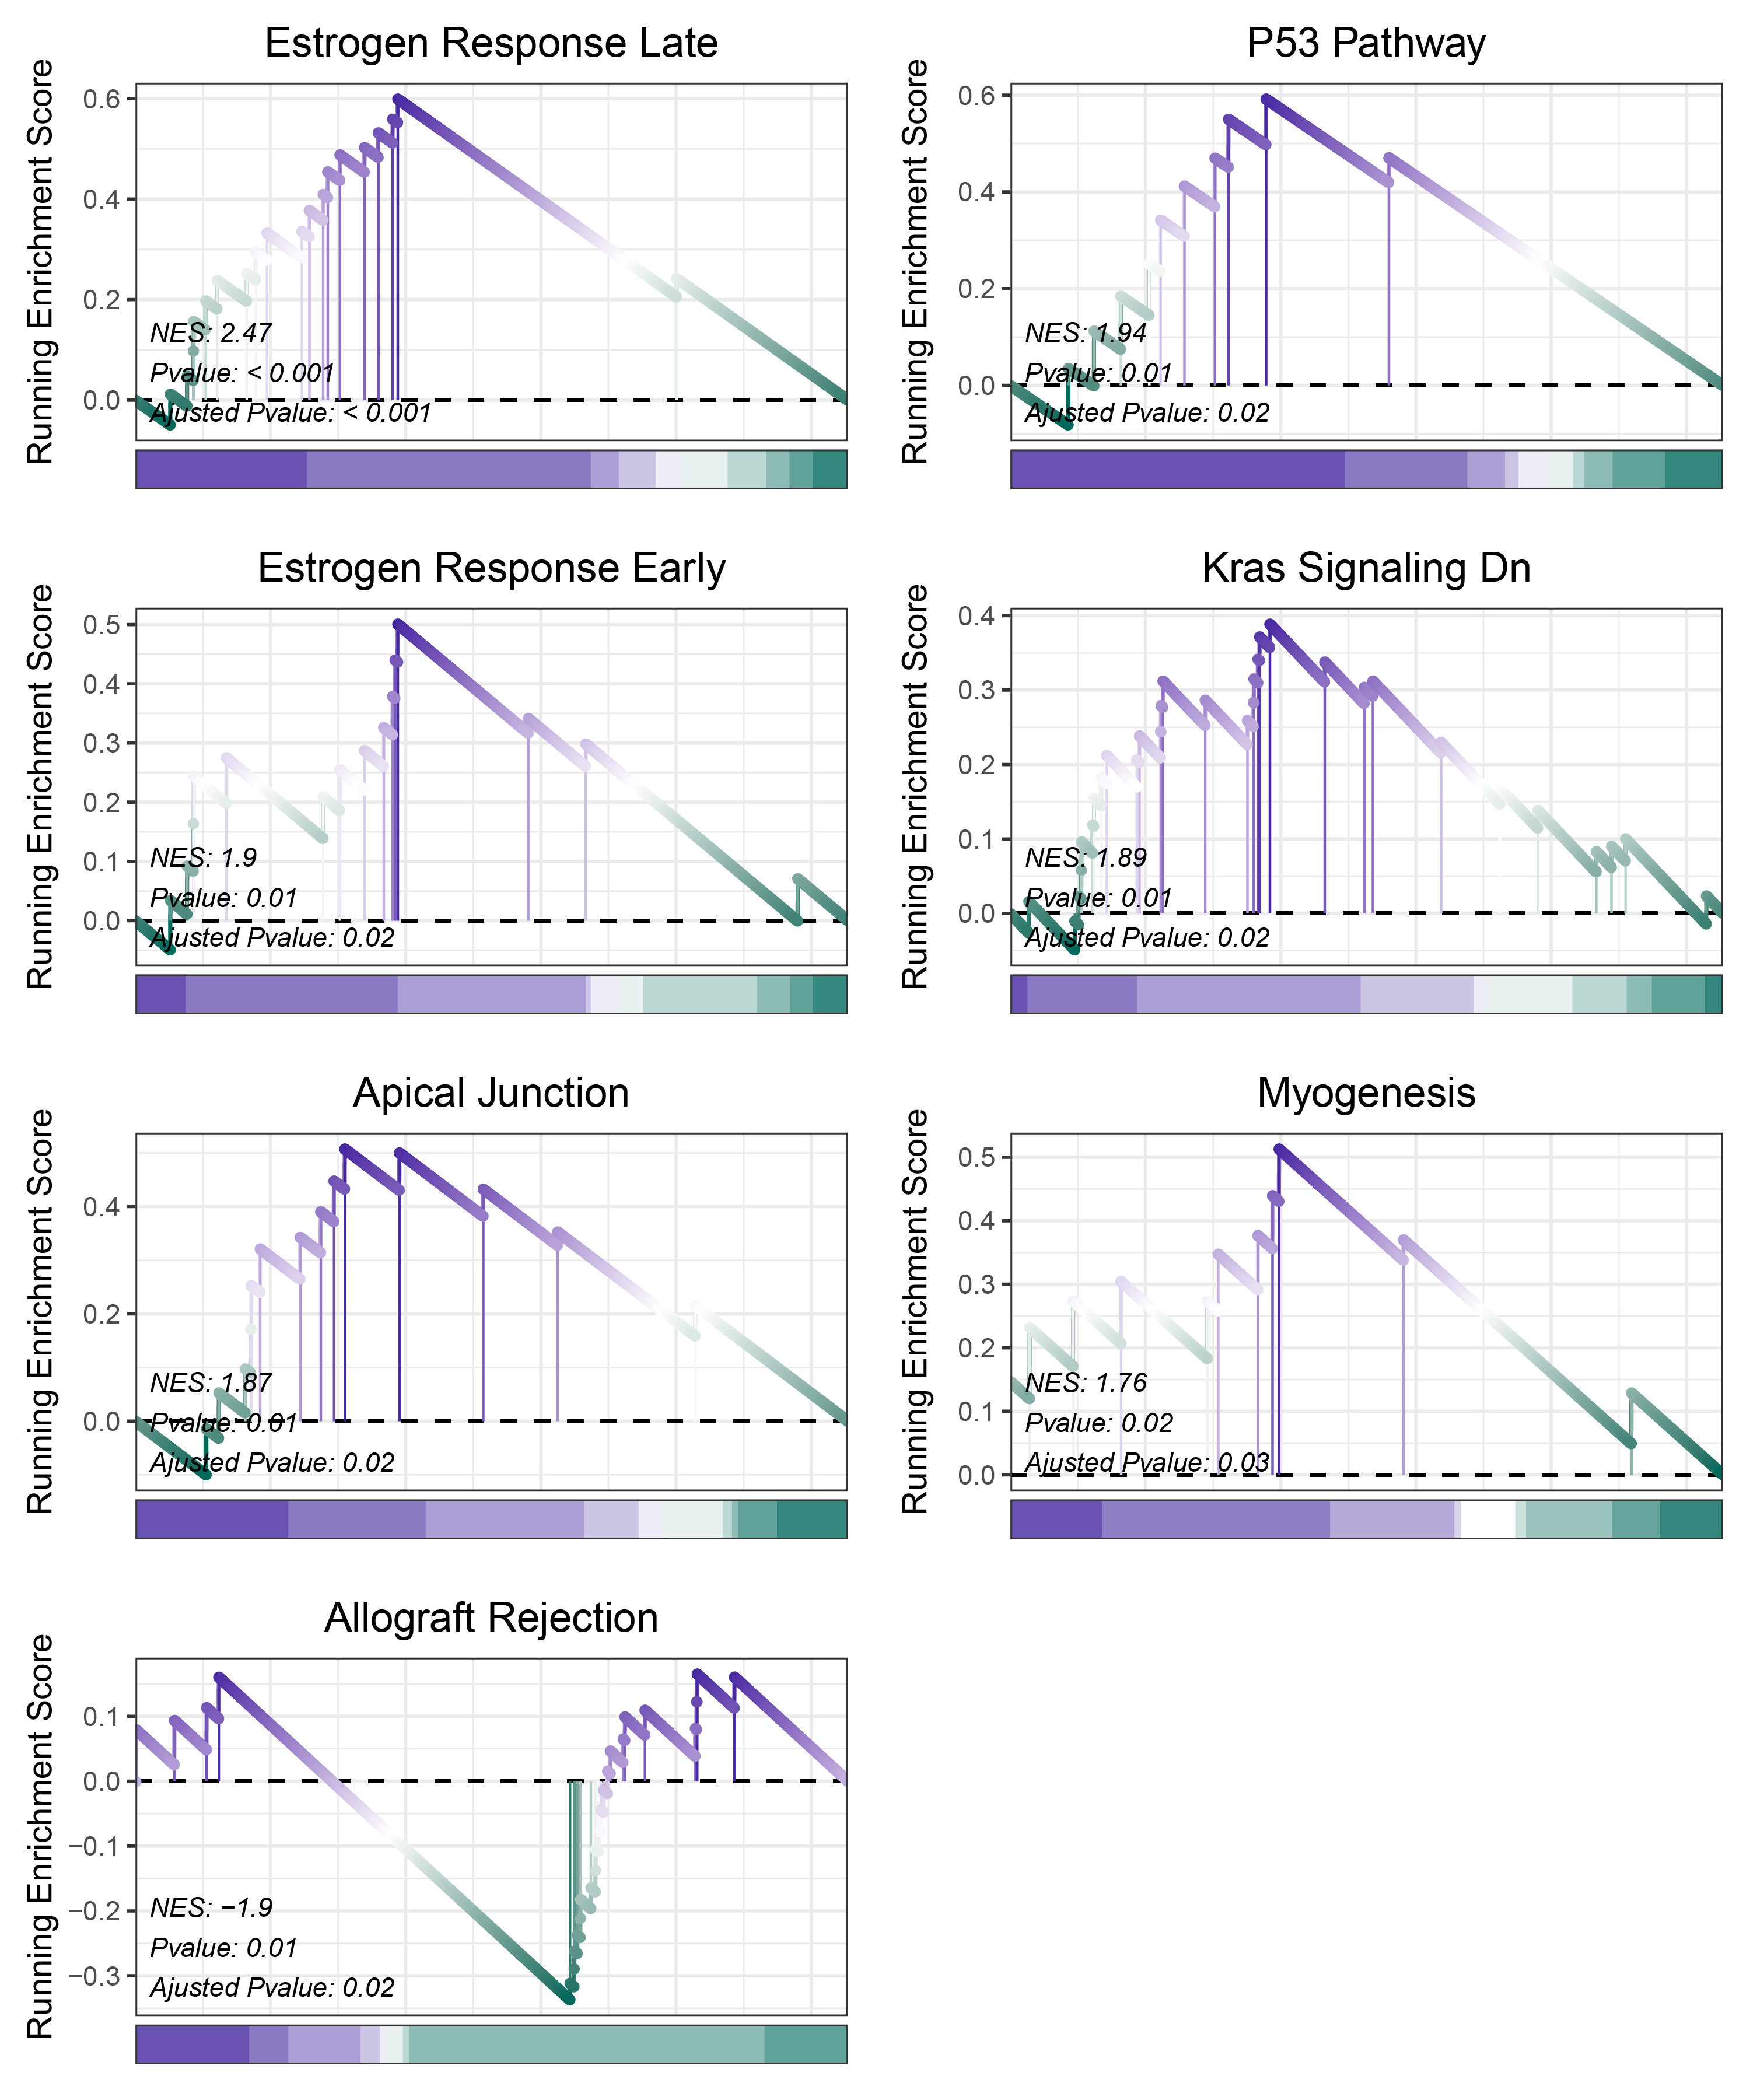
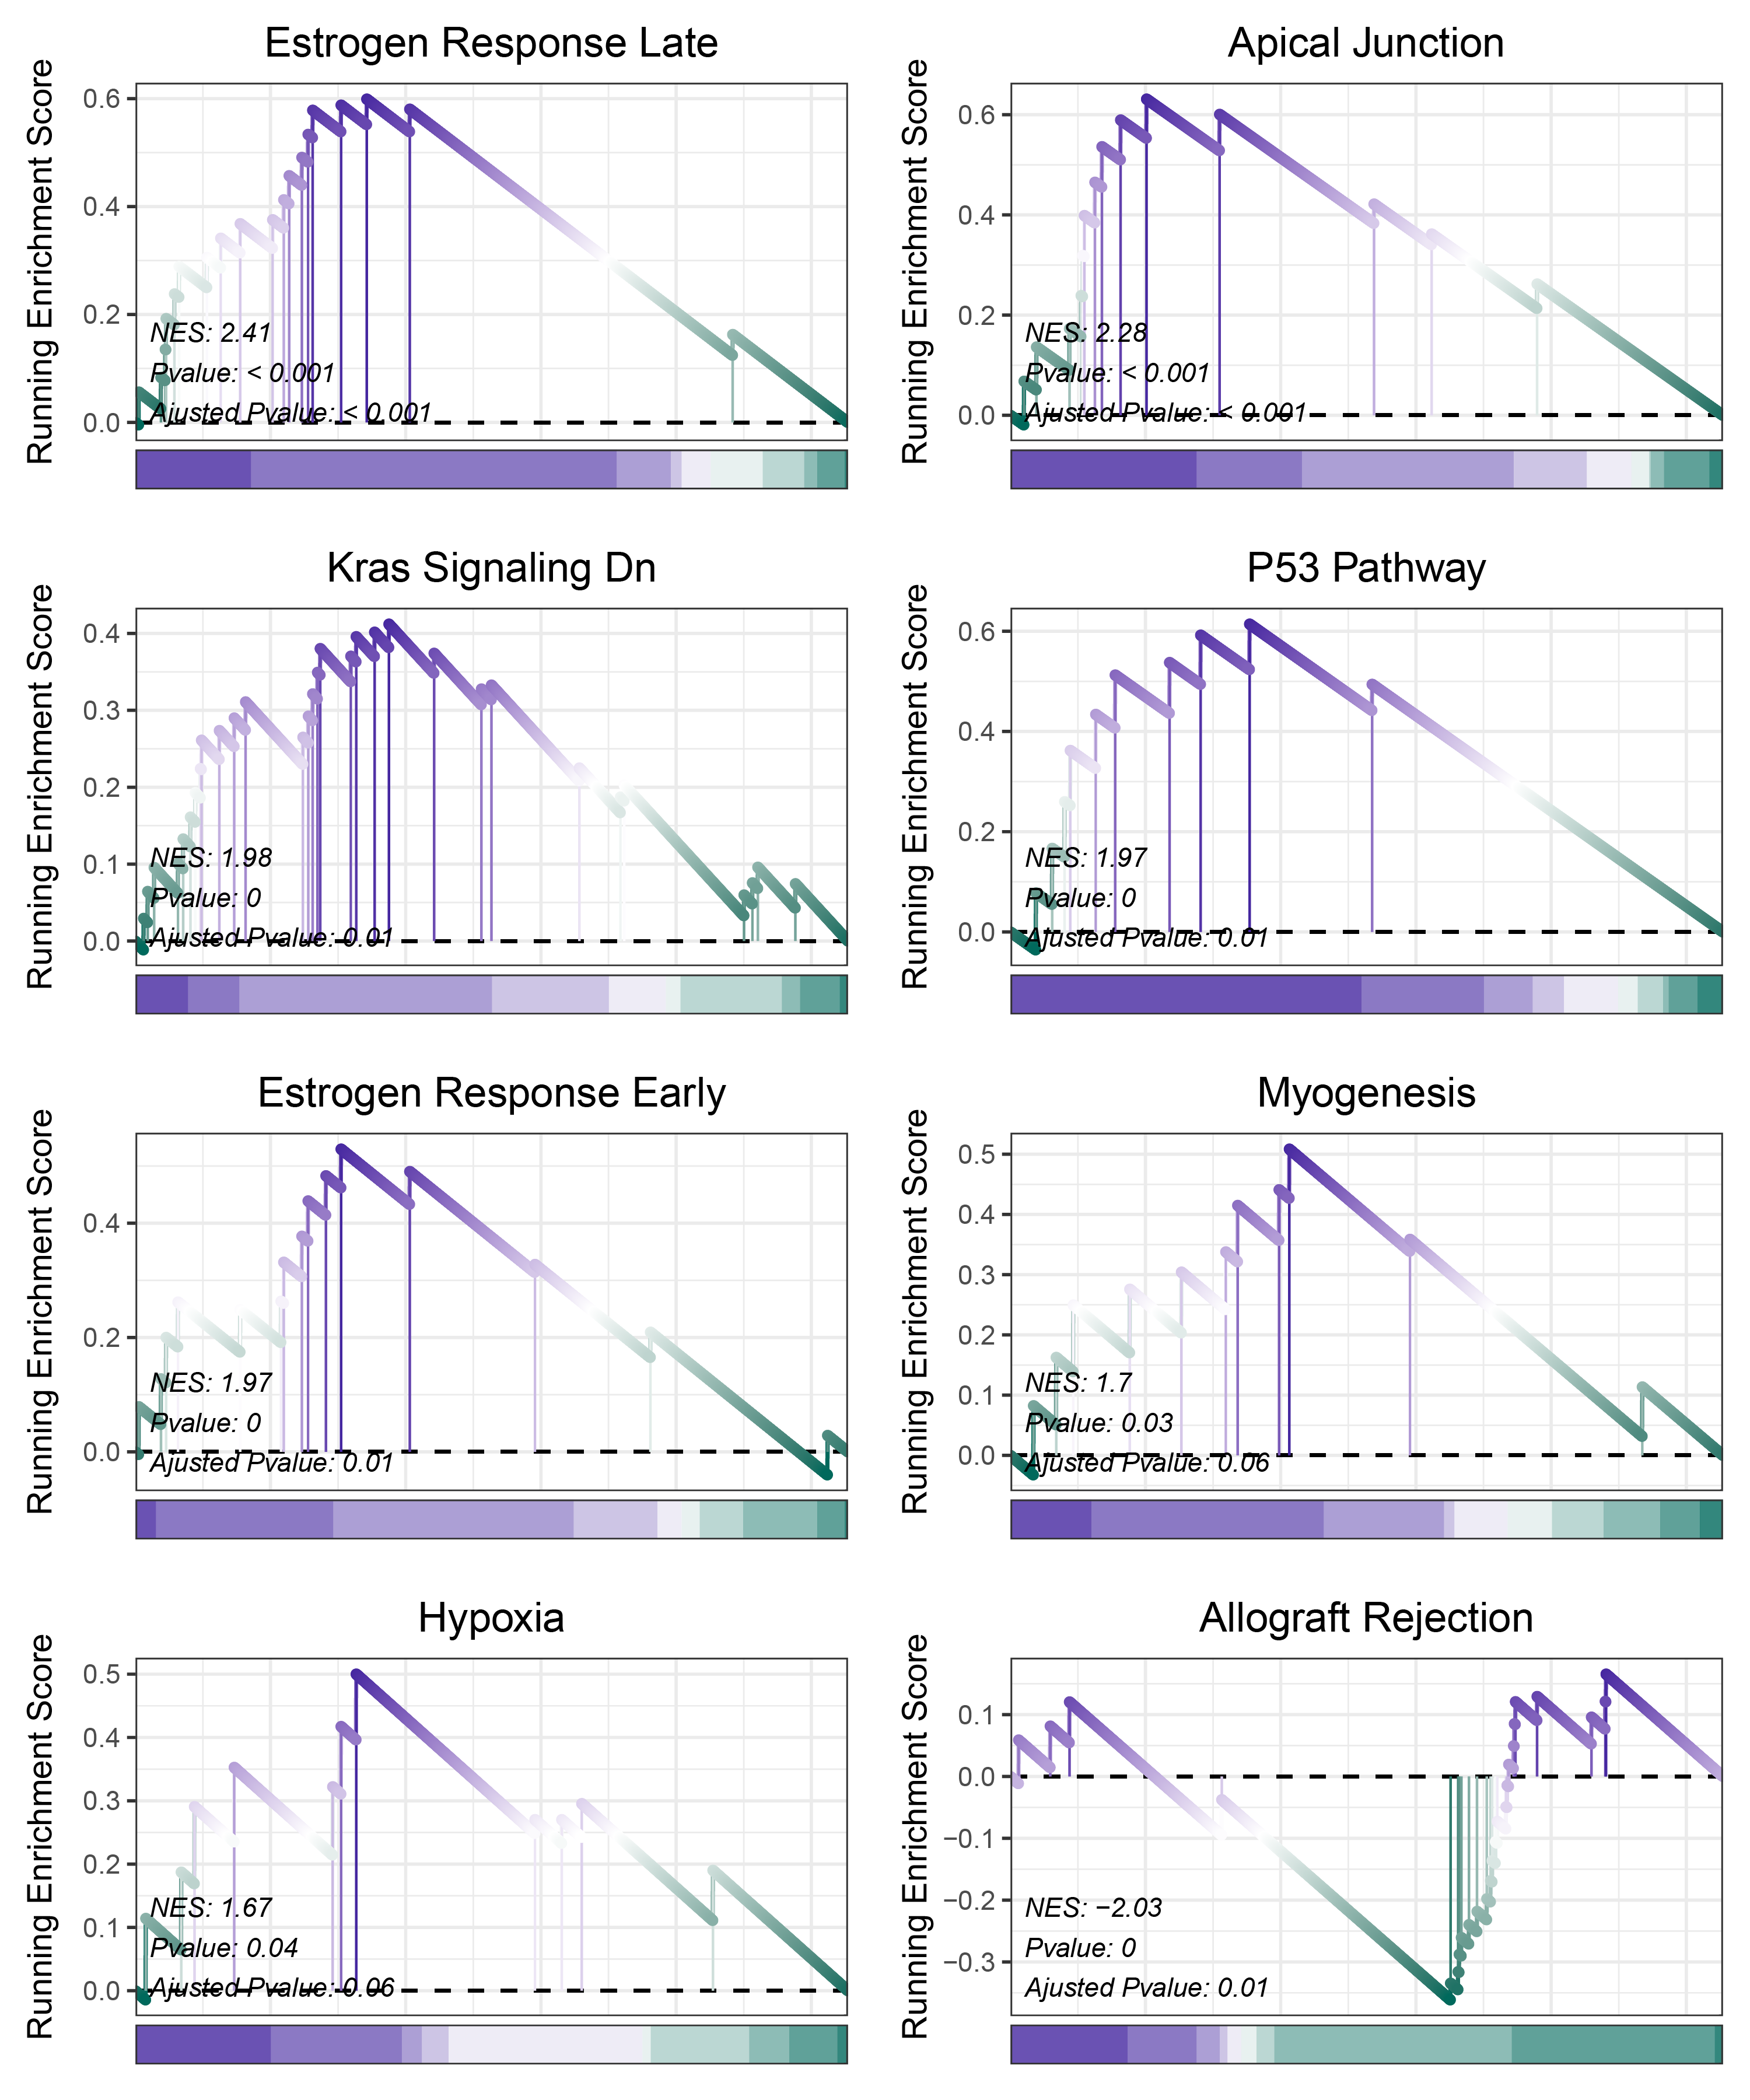
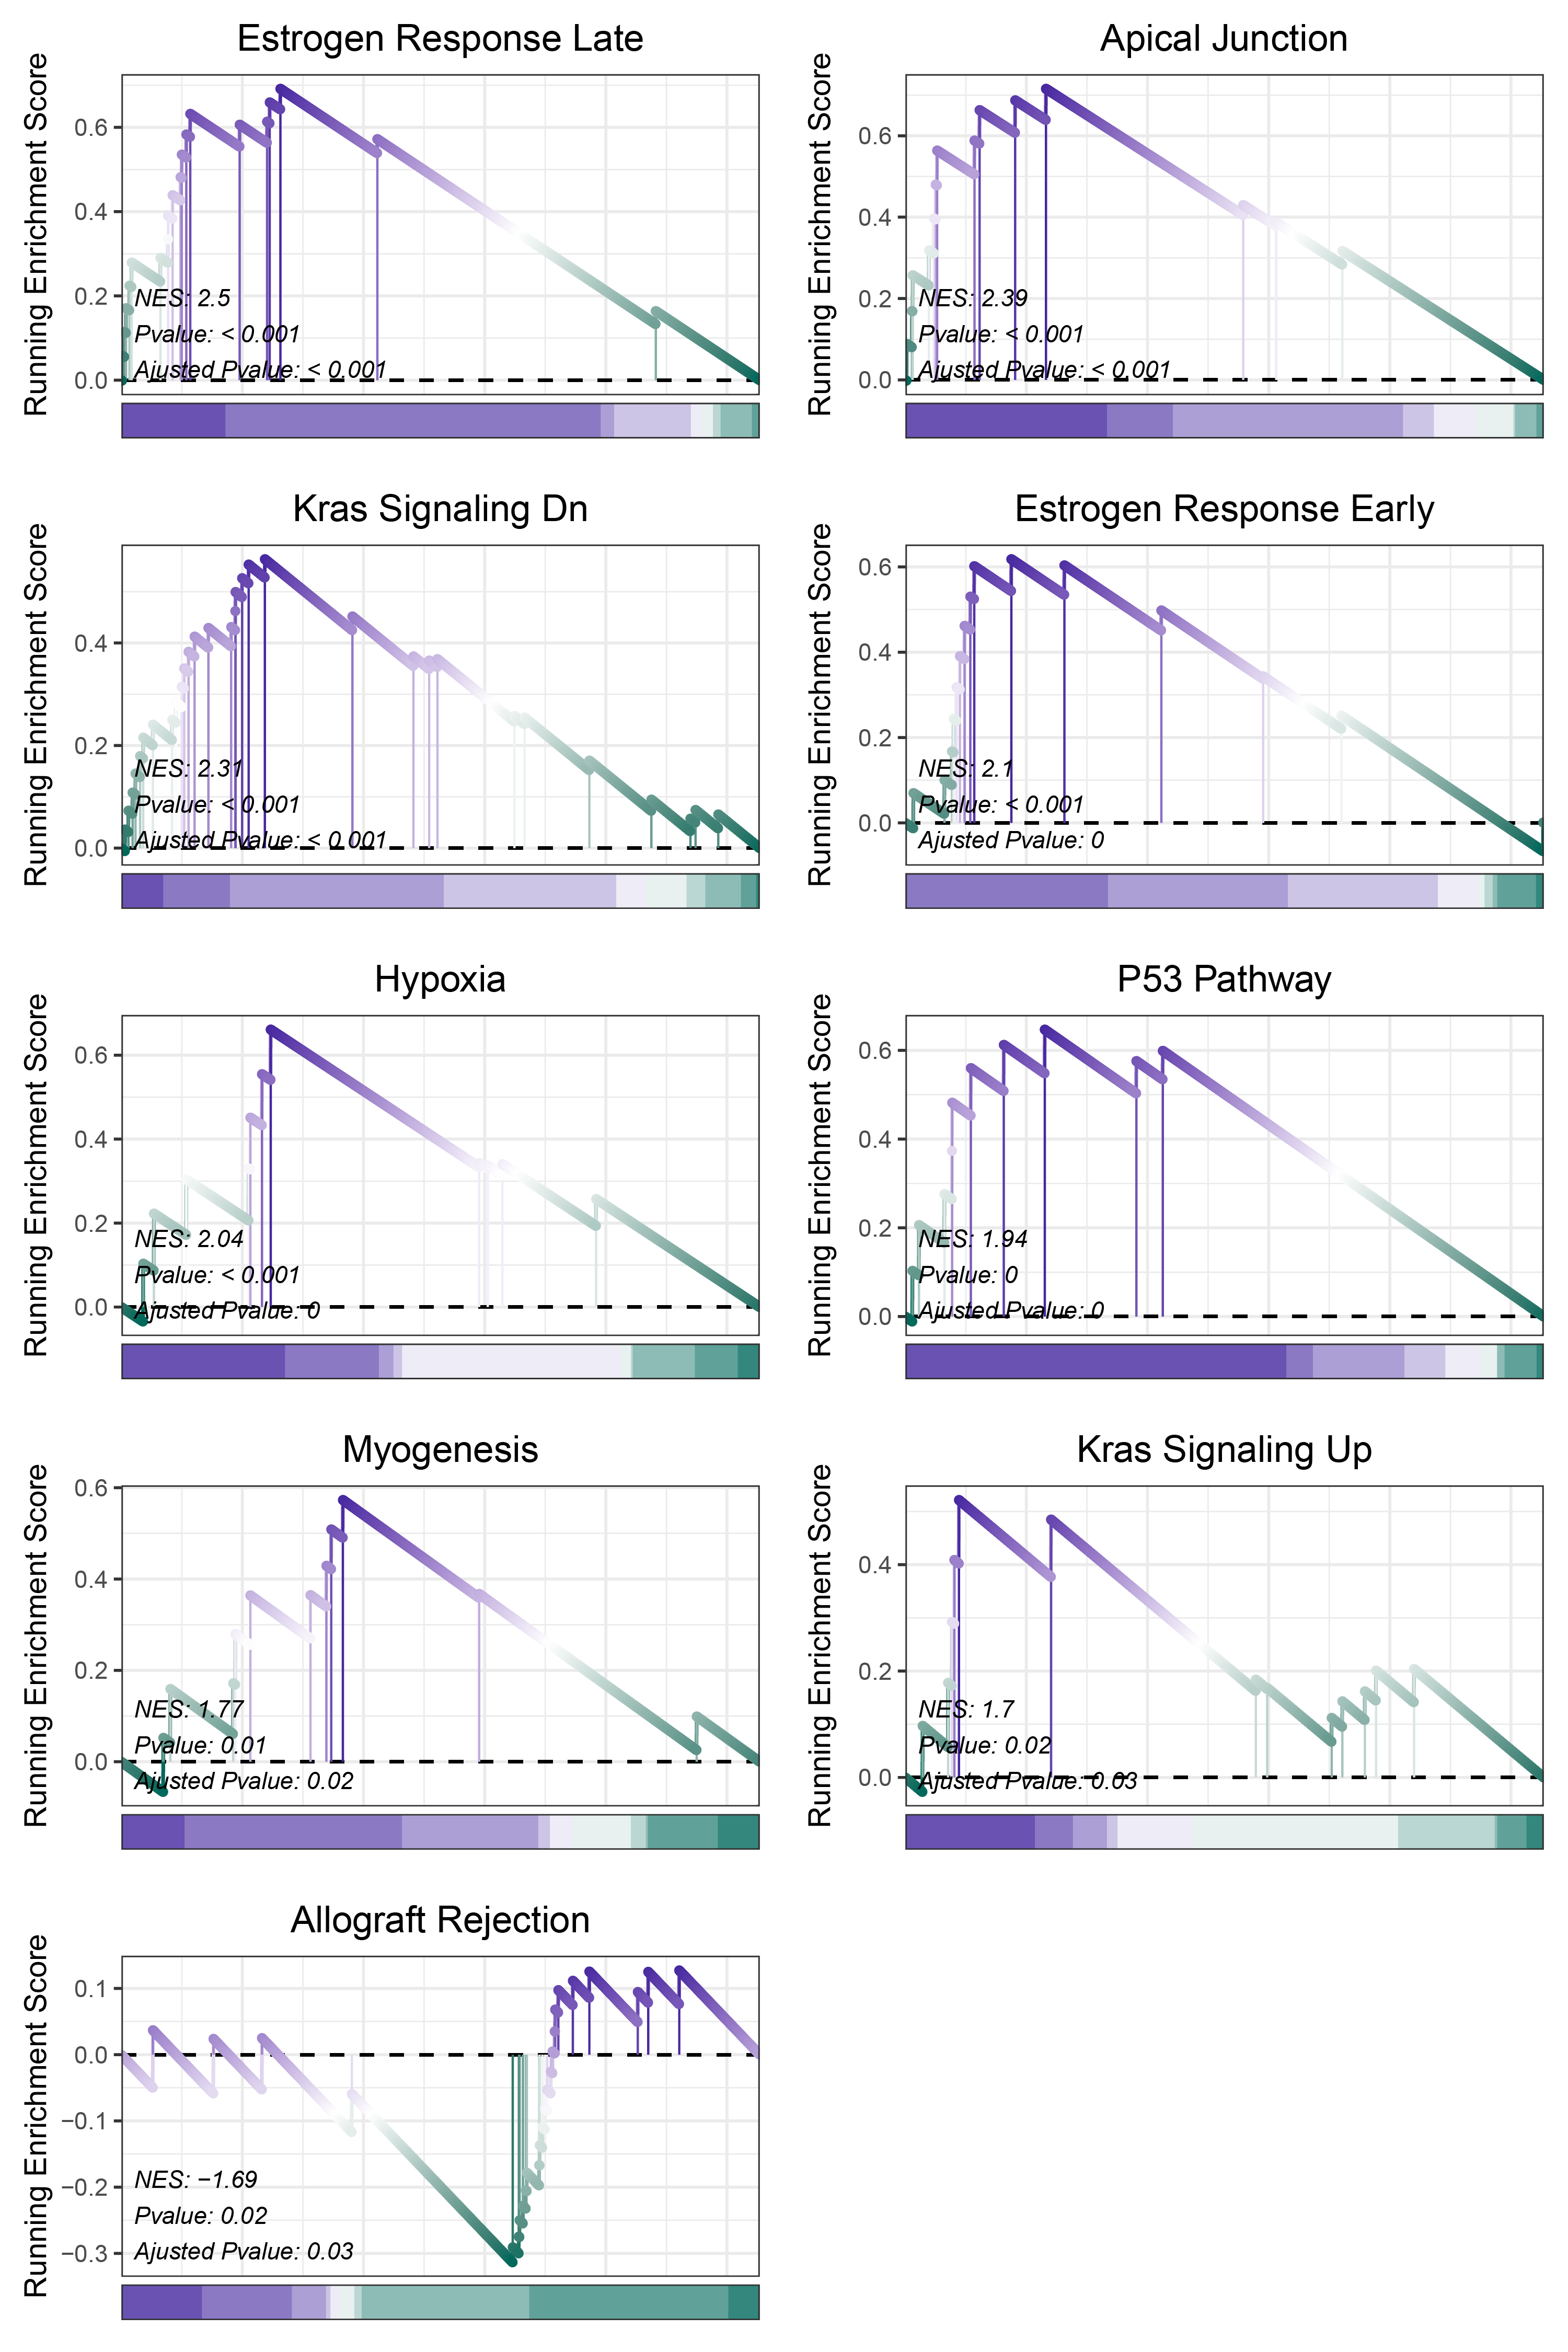
17.1.3 deseq2 HALLMARKS
print(deseq2_CFD_hallmarks_y@result$ID)

# plot
geneSetID = c("Estrogen Response Late",
              "P53 Pathway",
              "Estrogen Response Early",
              "Kras Signaling Dn",
              "Apical Junction",
              "Myogenesis",
              "Allograft Rejection")

lapply(geneSetID, function(x){
  gseaNb(object = deseq2_CFD_hallmarks_y,
          geneSetID = x,
          newGsea = T,
          addPval = T,
          pvalX = 0.02,pvalY = 0.1,
          pCol = 'black',
          pHjust = 0,
          subPlot = 2,newCurveCol = c("#00695c", "white", "#4527a0"),
          newHtCol = c("#4527a0", "white", "#00695c"))
}) -> gseaList1

# combine
cowplot::plot_grid(plotlist = gseaList1,ncol = 2,align = 'hv')
deseq2_CFD_hallmarks
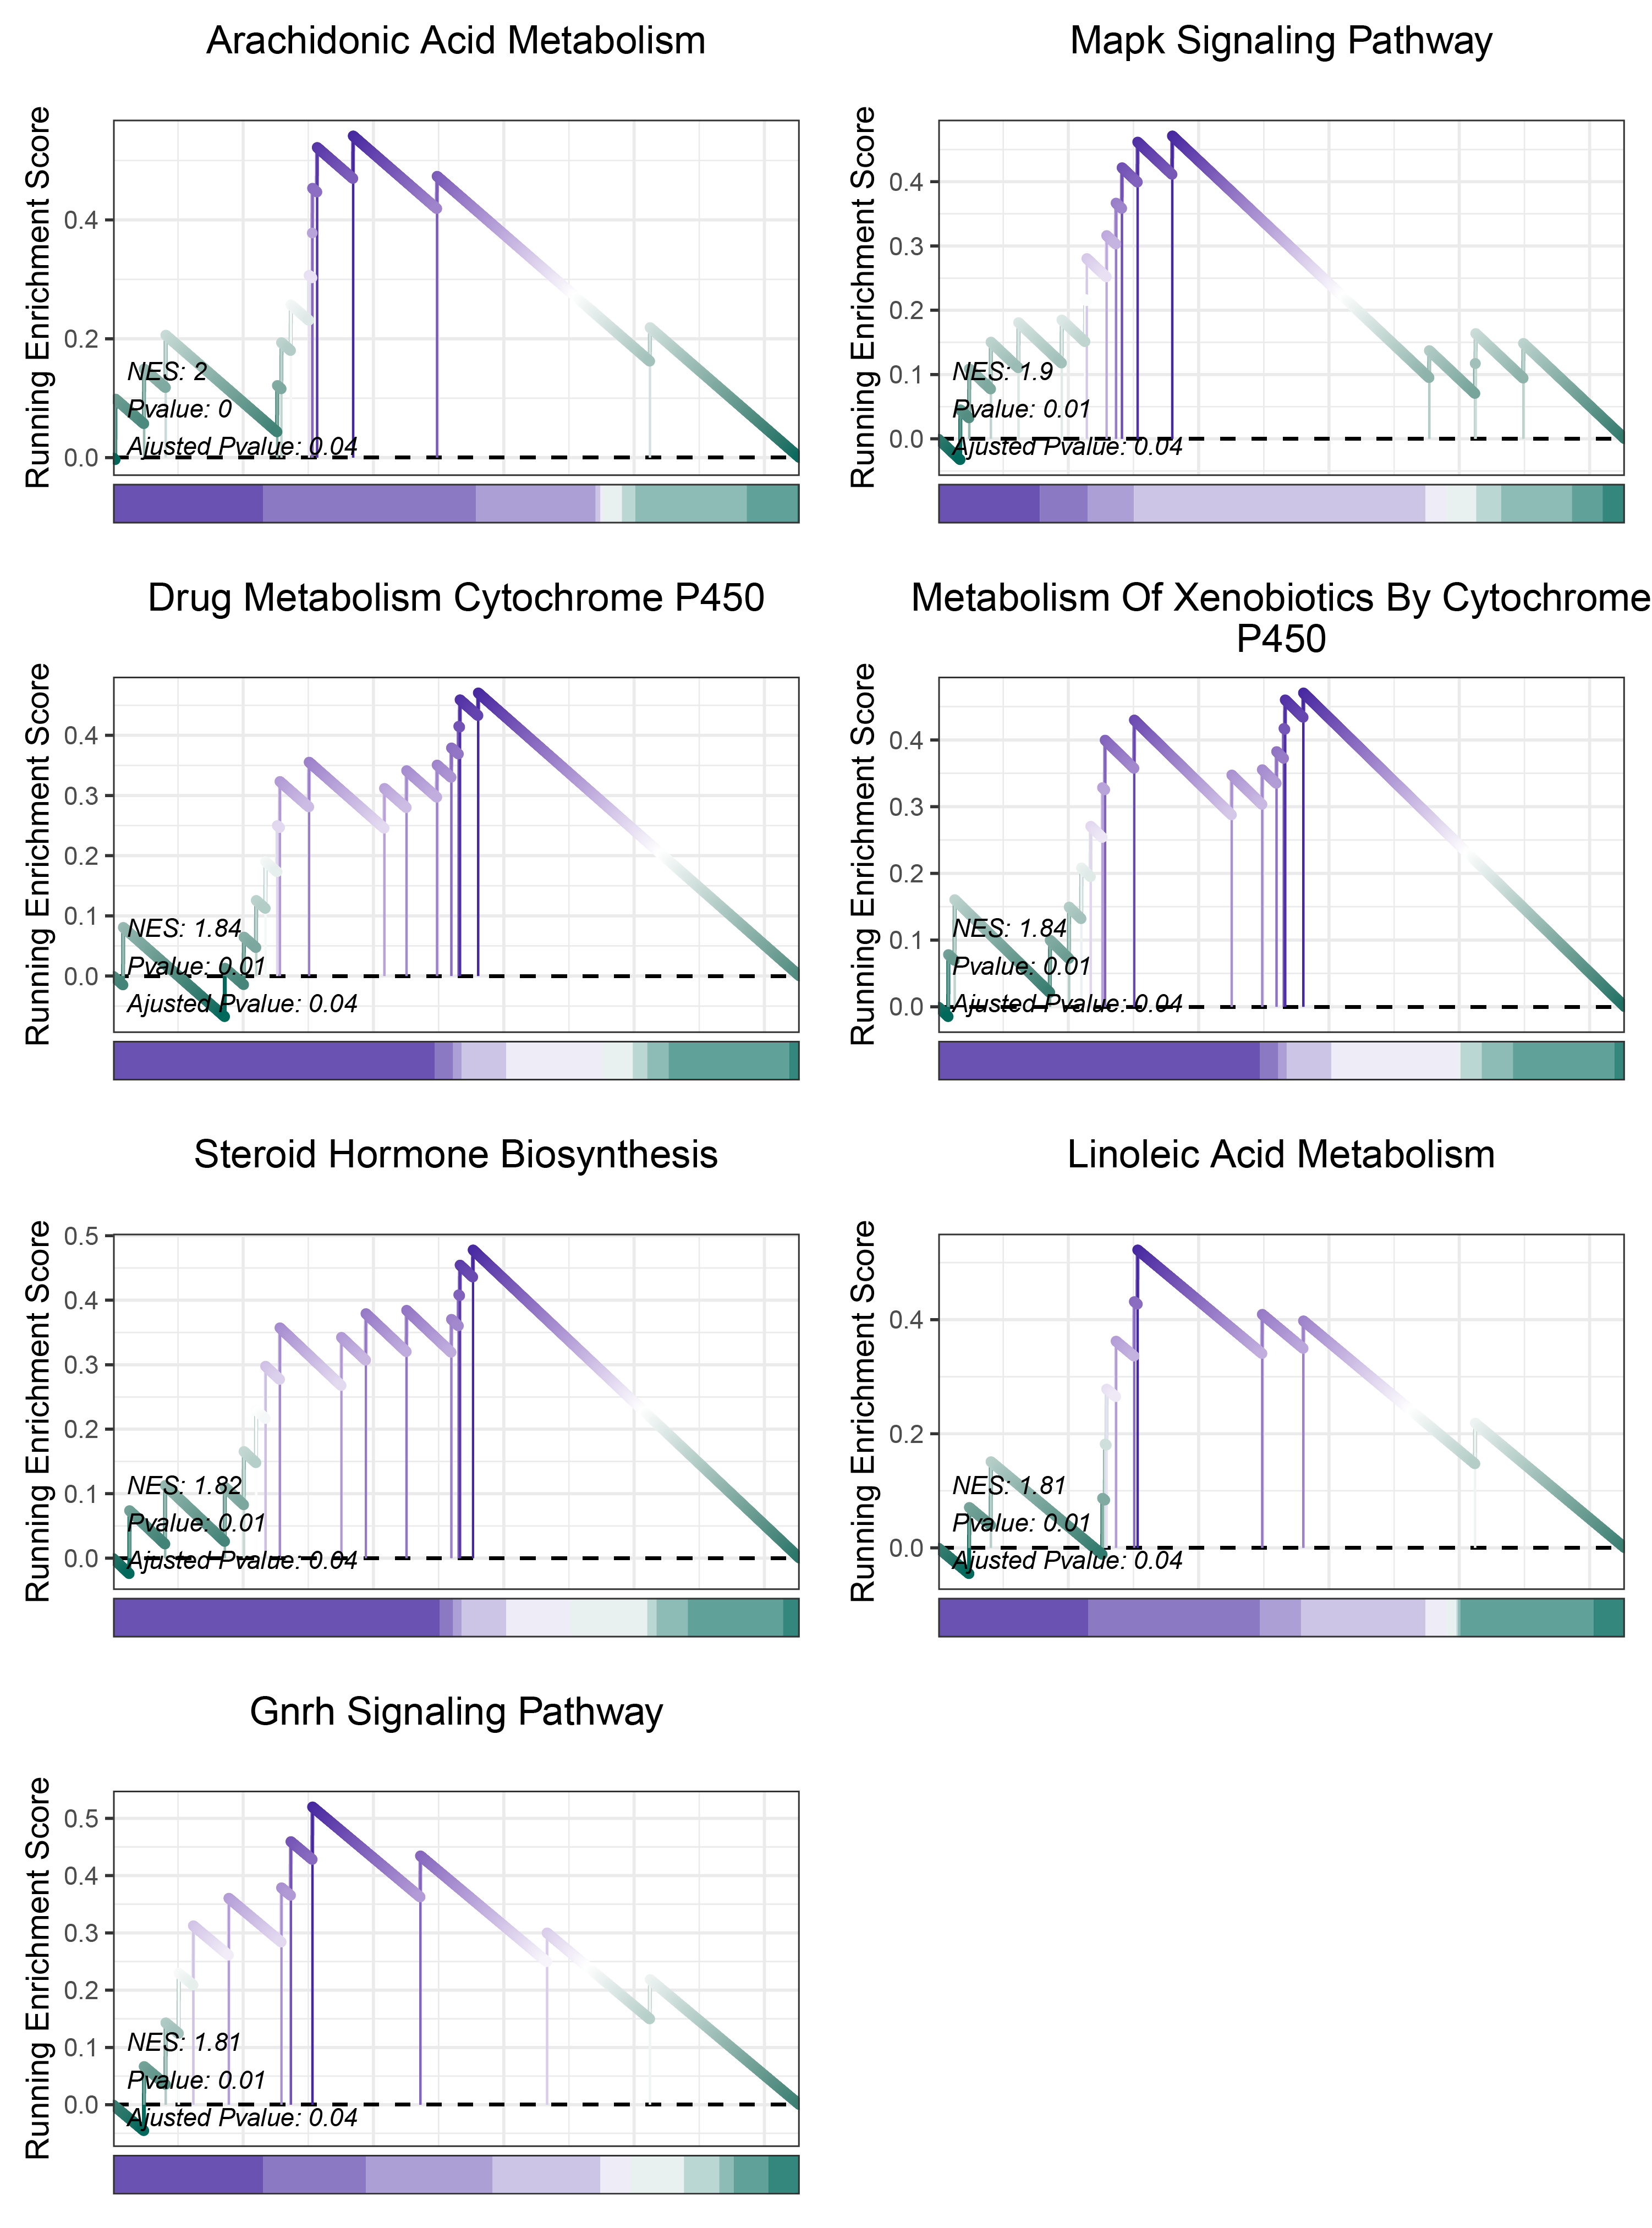
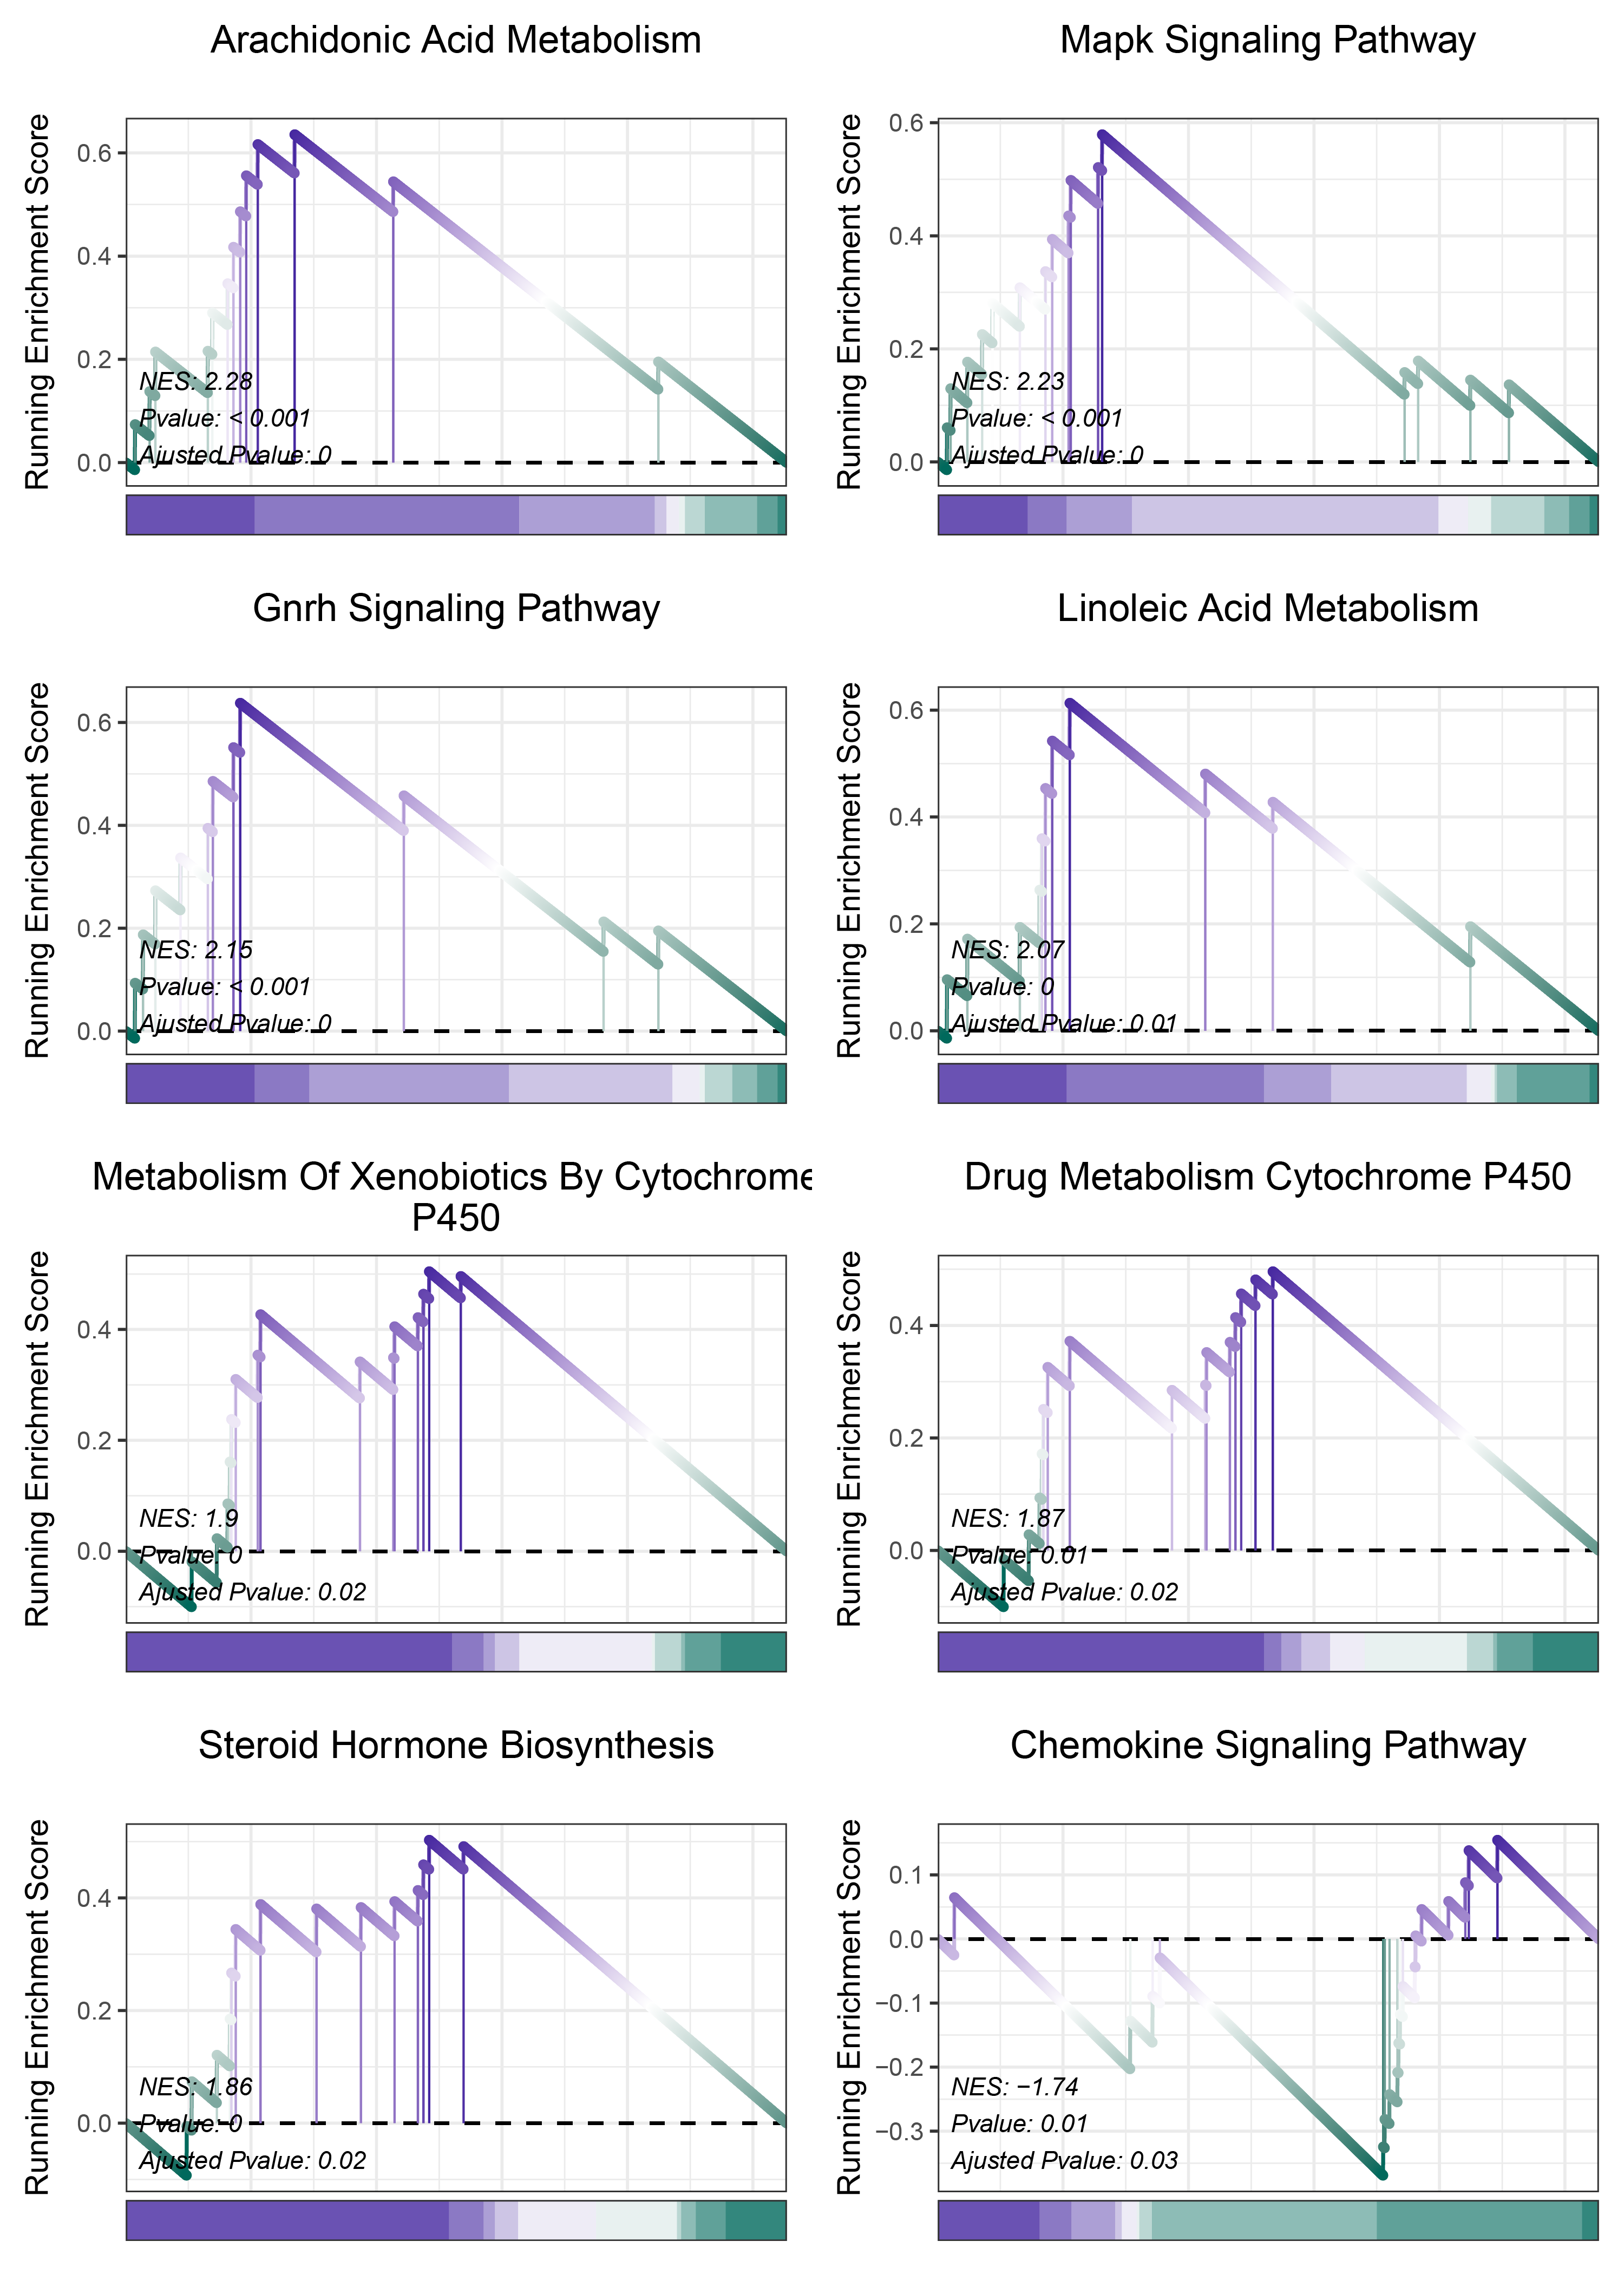
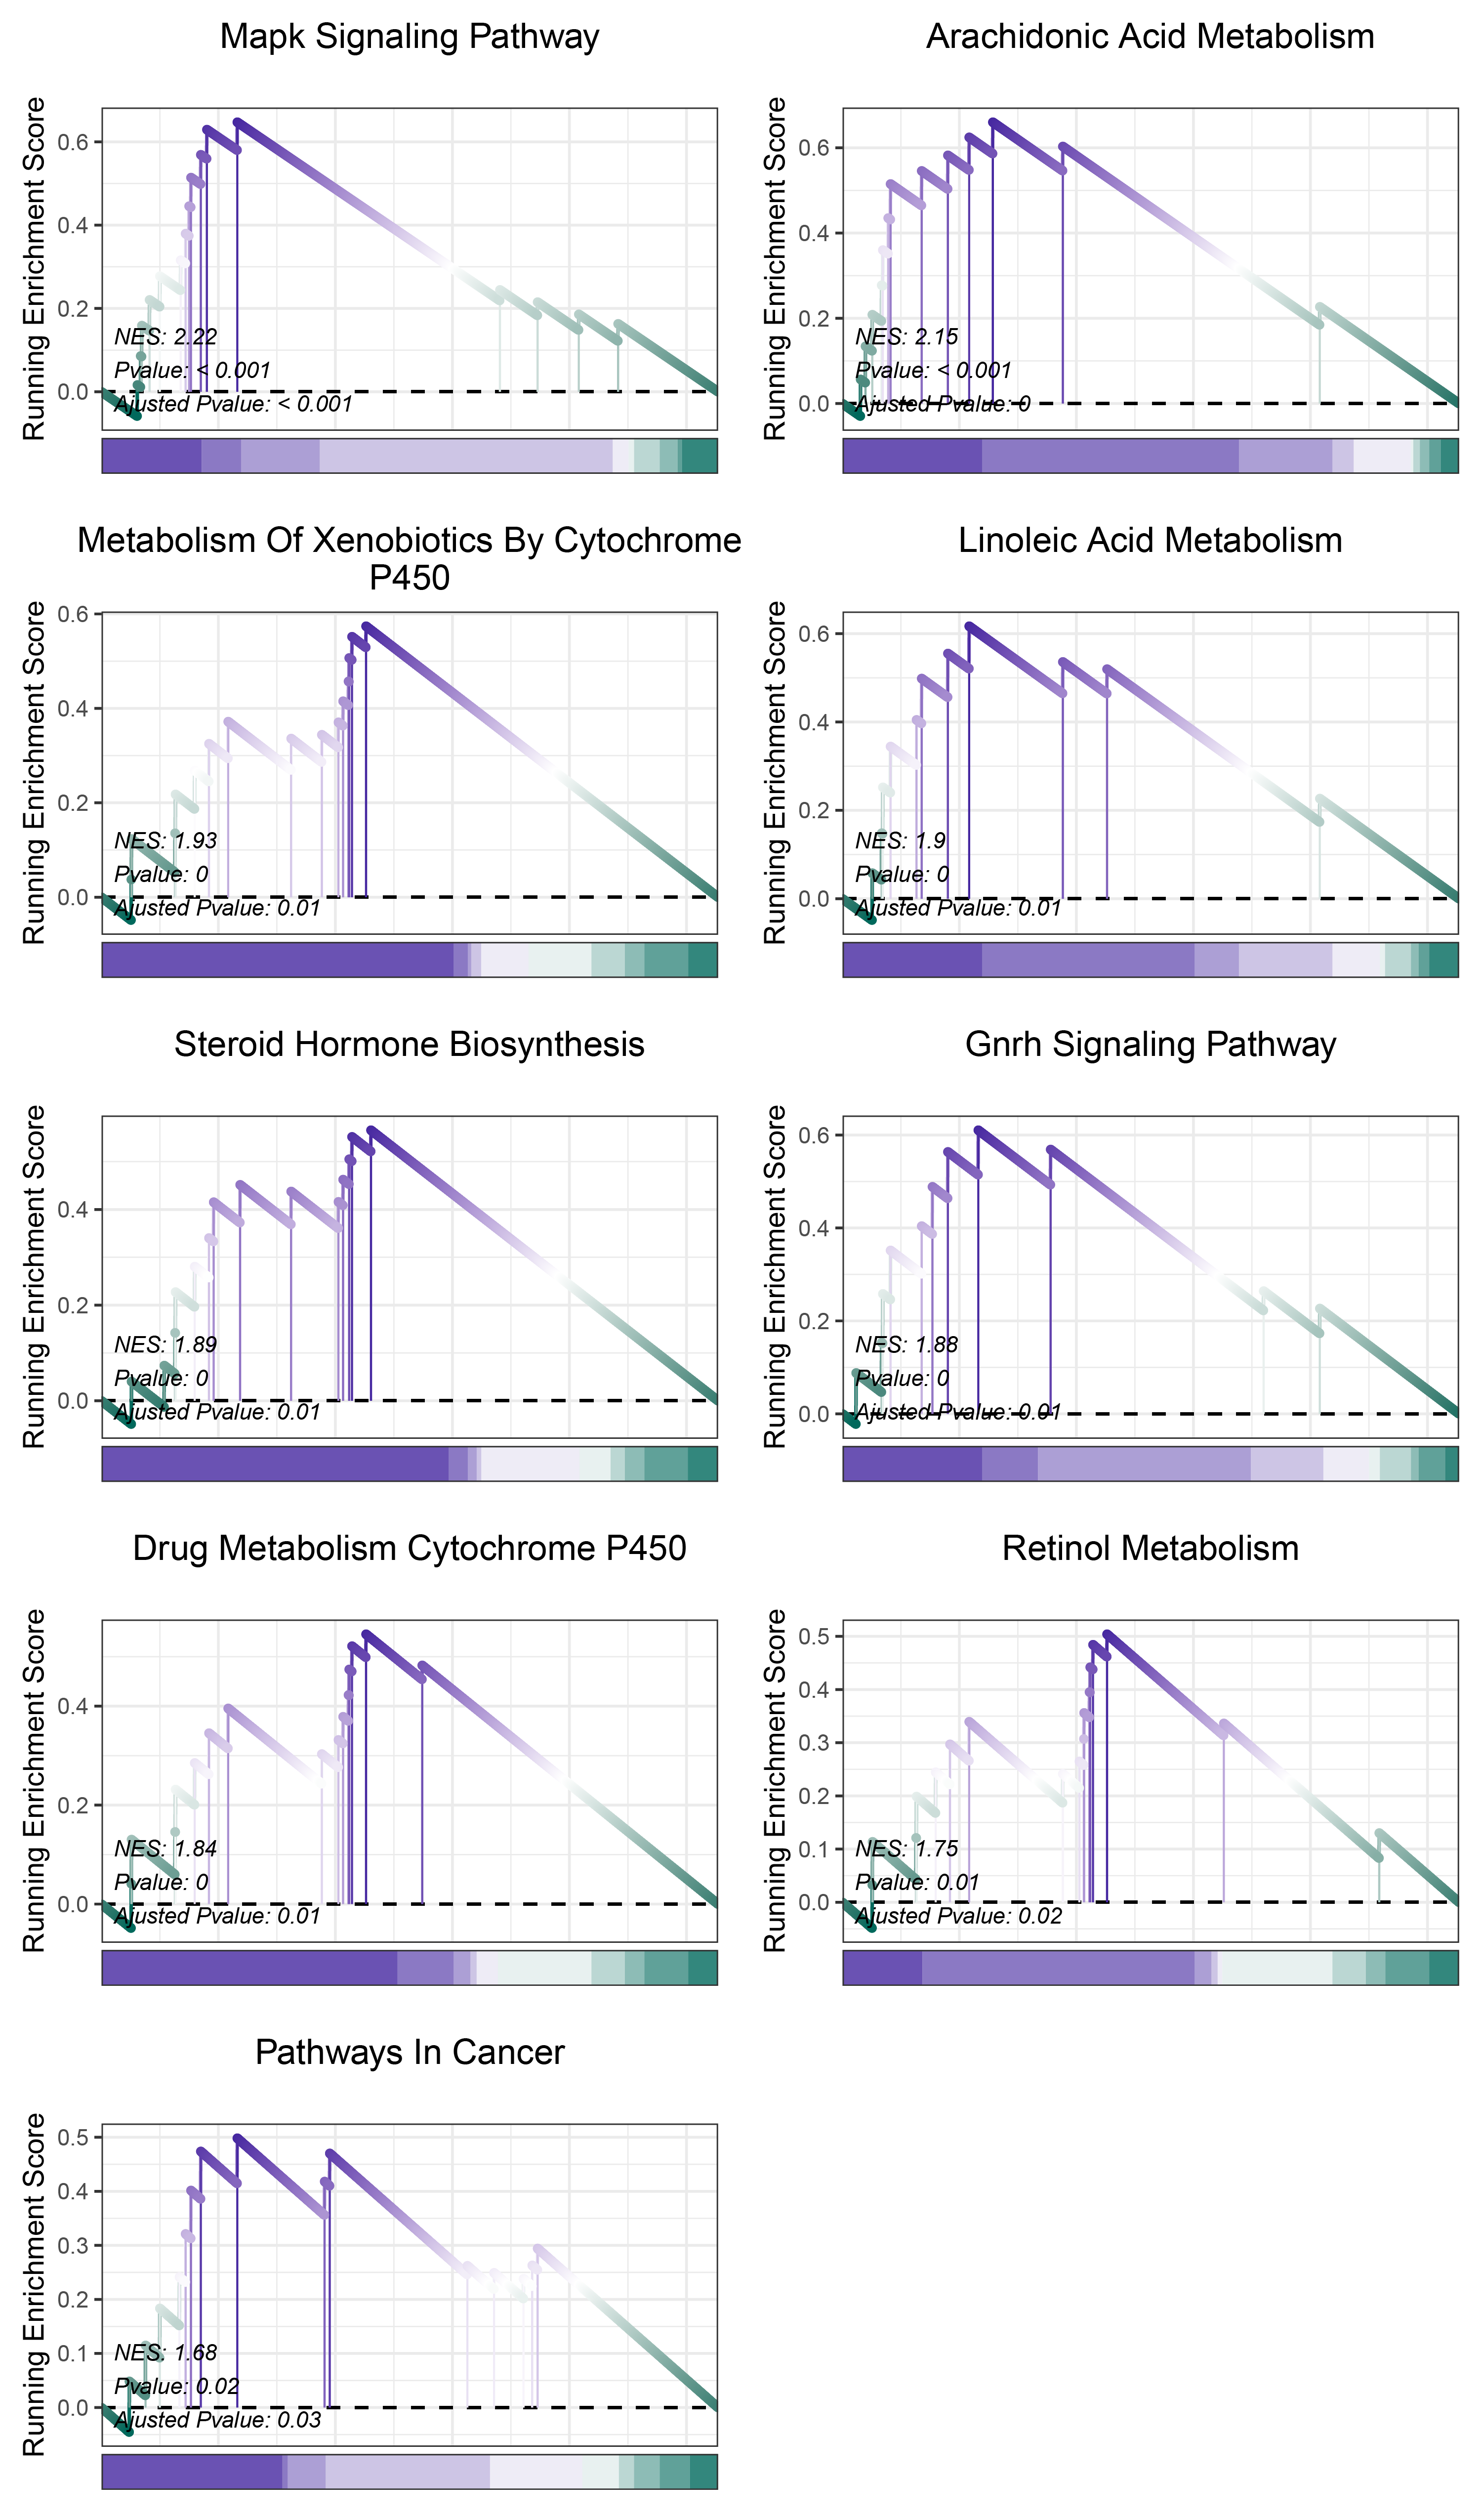
17.1.4 deseq2 KEGG
print(deseq2_CFD_kegg_y@result$ID)

# plot
geneSetID = c("Arachidonic Acid Metabolism",
              "Mapk Signaling Pathway",
              "Drug Metabolism Cytochrome P450",
              "Metabolism Of Xenobiotics By Cytochrome P450",
              "Steroid Hormone Biosynthesis",
              "Linoleic Acid Metabolism",
              "Gnrh Signaling Pathway")

lapply(geneSetID, function(x){
  gseaNb(object = deseq2_CFD_kegg_y,
          geneSetID = x,
          newGsea = T,
          addPval = T,
          pvalX = 0.02,pvalY = 0.1,
          pCol = 'black',
          pHjust = 0,
          subPlot = 2,newCurveCol = c("#00695c", "white", "#4527a0"),
          newHtCol = c("#4527a0", "white", "#00695c"))
}) -> gseaList1

# combine
cowplot::plot_grid(plotlist = gseaList1,ncol = 2,align = 'hv')
deseq2_CFD_kegg
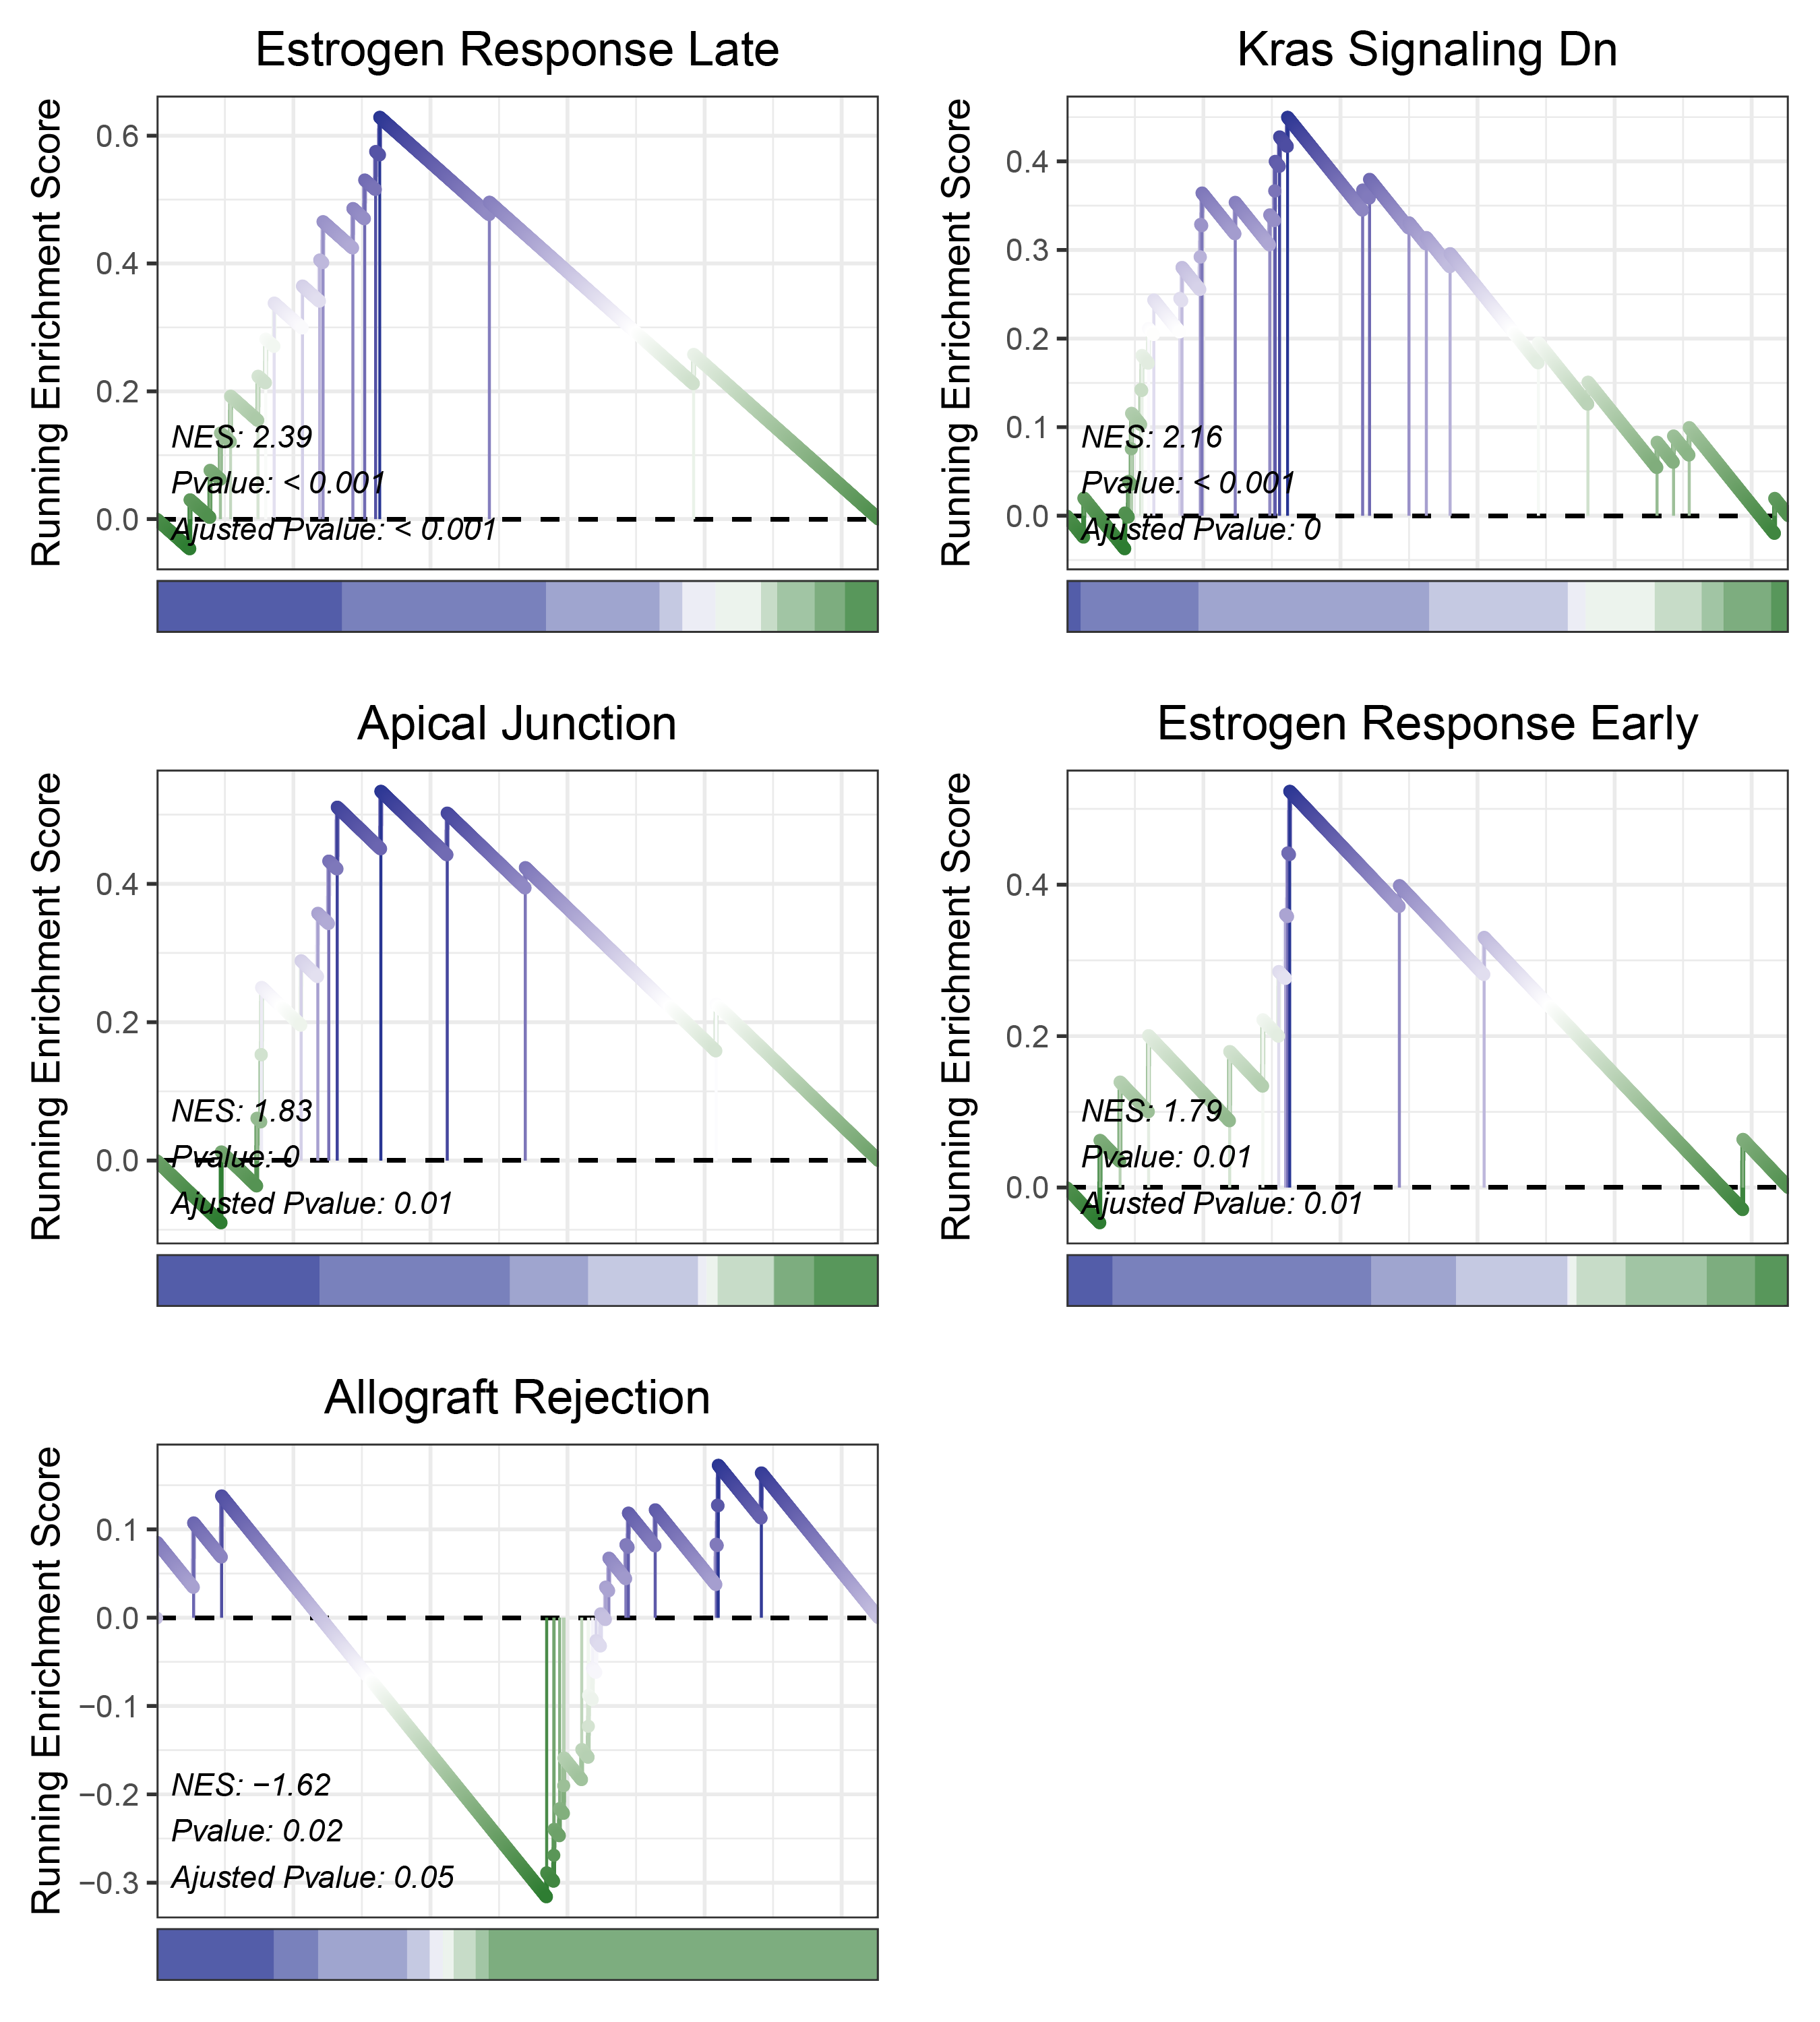
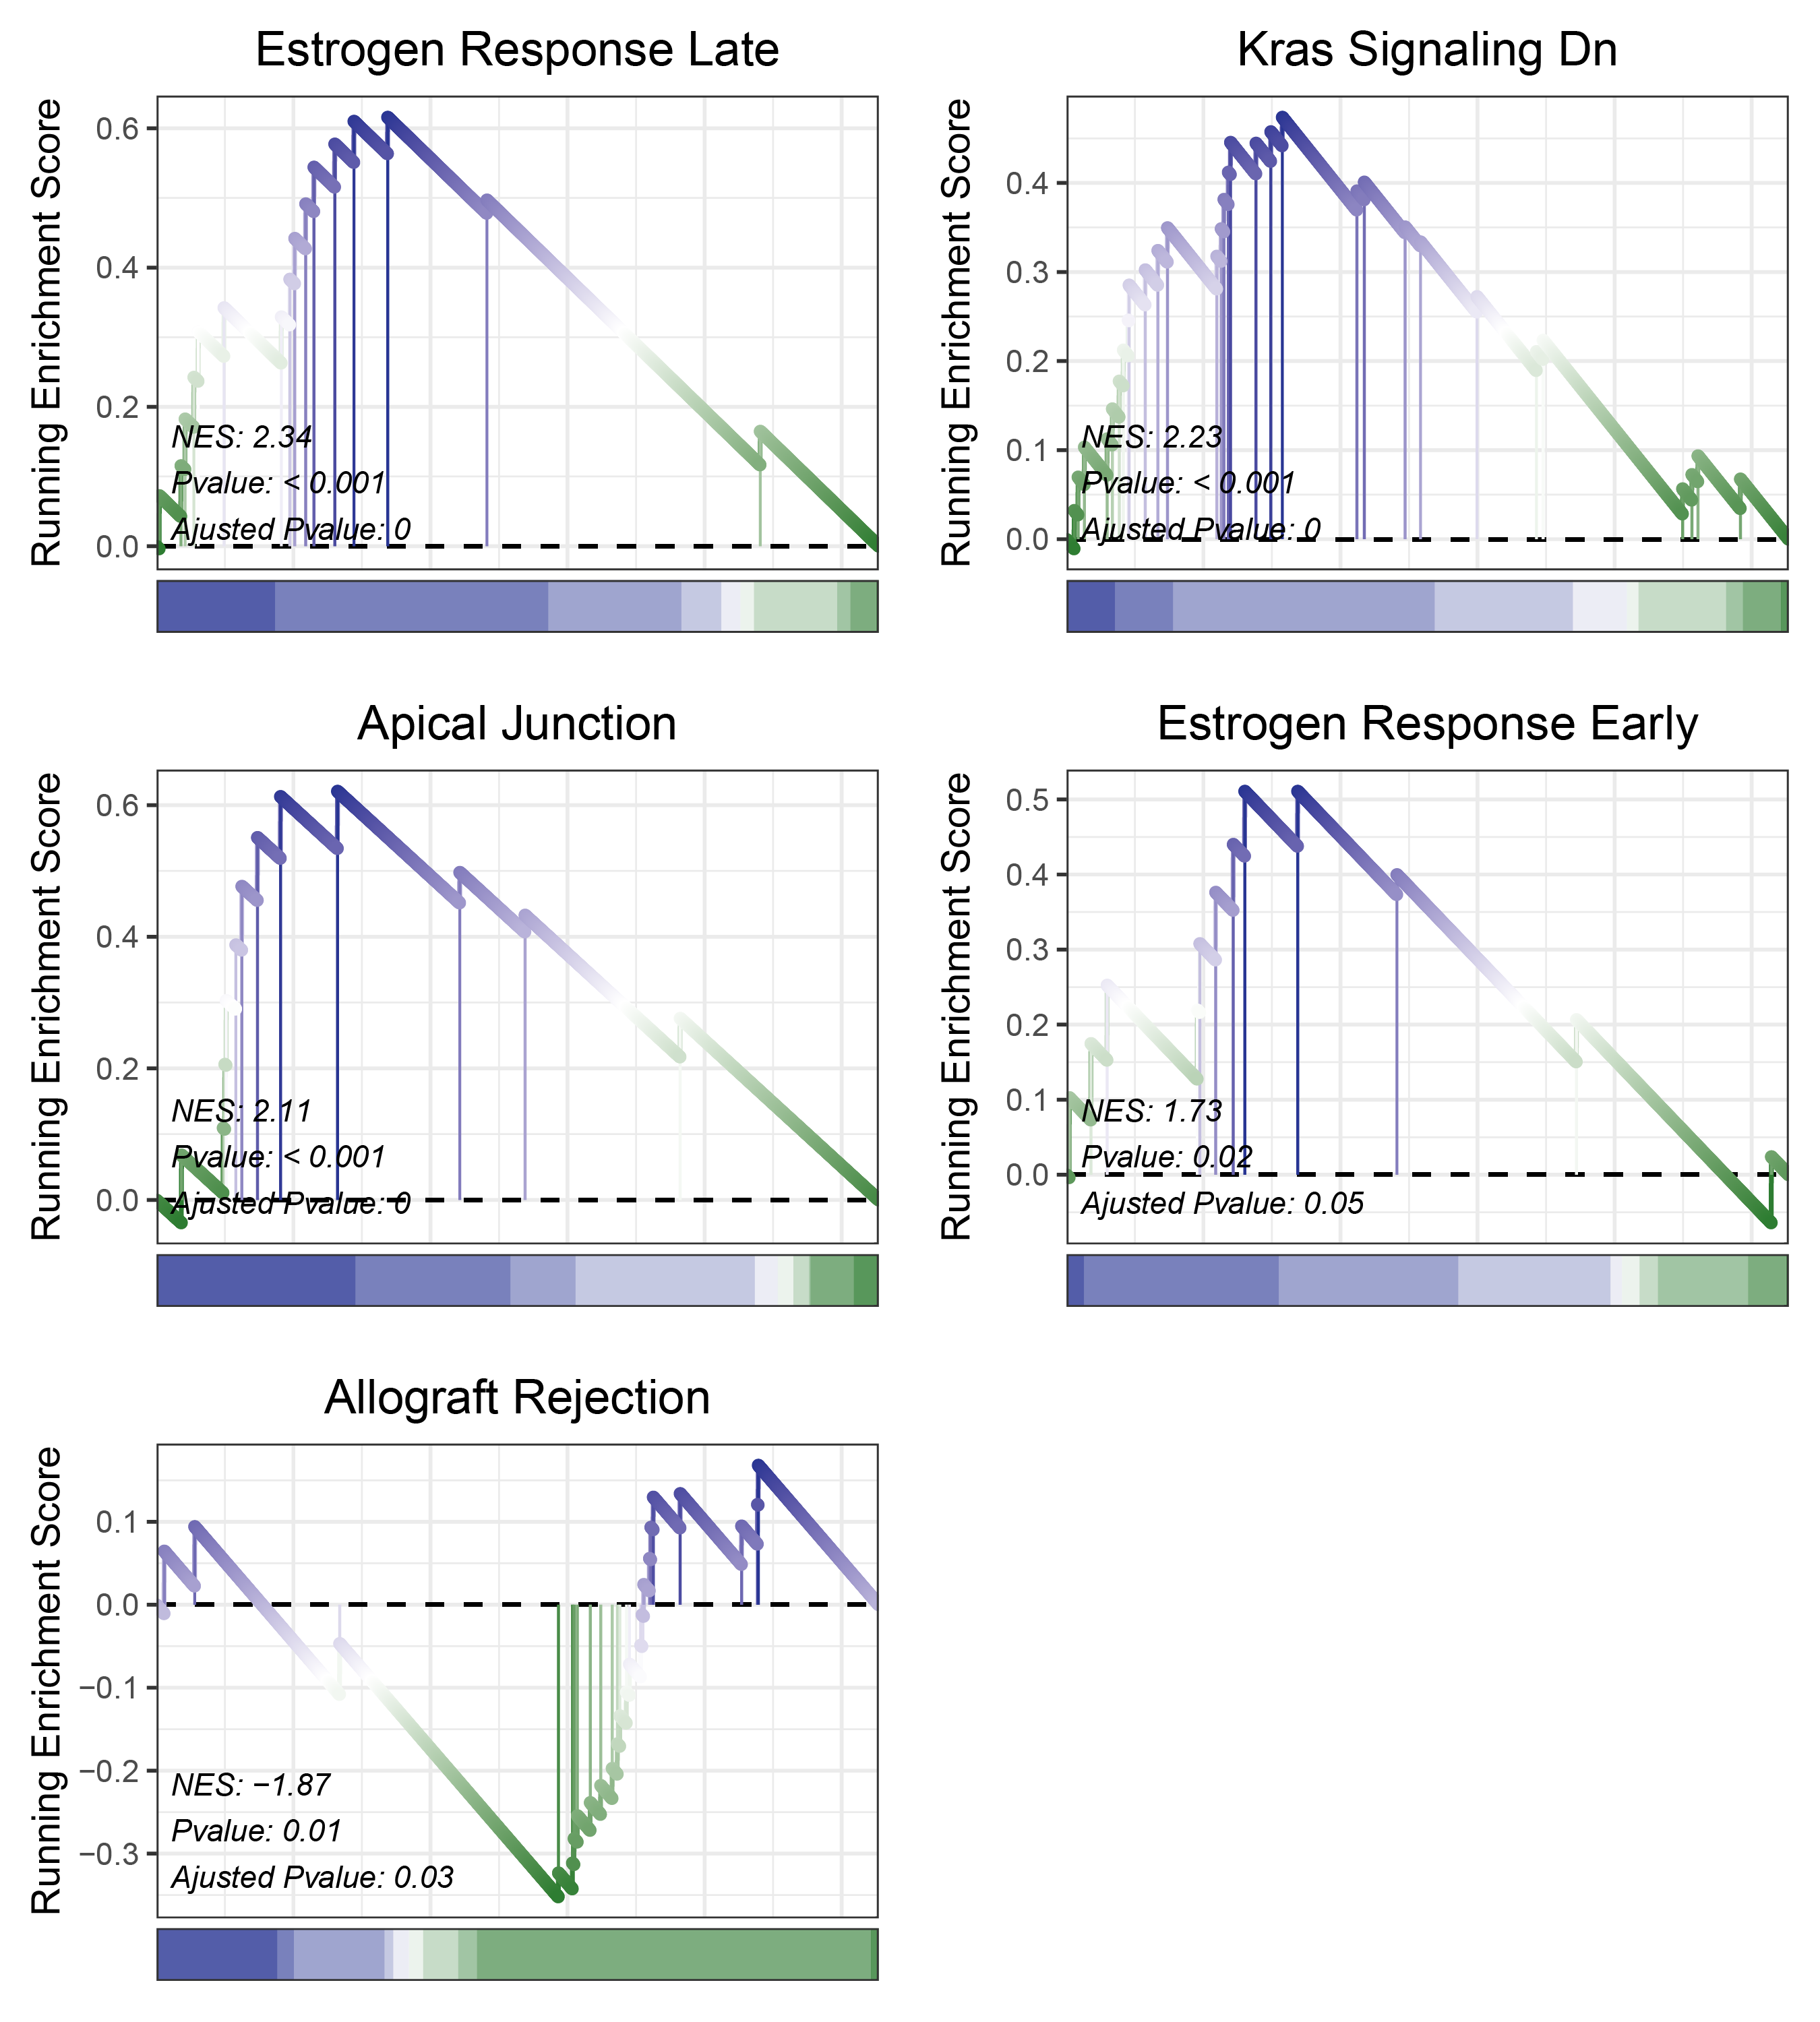
17.1.5 edgeR HALLMARKS
print(edgeR_CFD_hallmarks_y@result$ID)

# plot
geneSetID = c("Estrogen Response Late",
              "Kras Signaling Dn",
              "Apical Junction",
              "Estrogen Response Early",
              "Allograft Rejection")

lapply(geneSetID, function(x){
  gseaNb(object = edgeR_CFD_hallmarks_y,
          geneSetID = x,
          newGsea = T,
          addPval = T,
          pvalX = 0.02,pvalY = 0.1,
          pCol = 'black',
          pHjust = 0,
          subPlot = 2,newCurveCol = c("#2e7d32", "white", "#283593"),
          newHtCol = c("#283593", "white", "#2e7d32"))
}) -> gseaList1

# combine
cowplot::plot_grid(plotlist = gseaList1,ncol = 2,align = 'hv')
edgeR_CFD_hallmarks
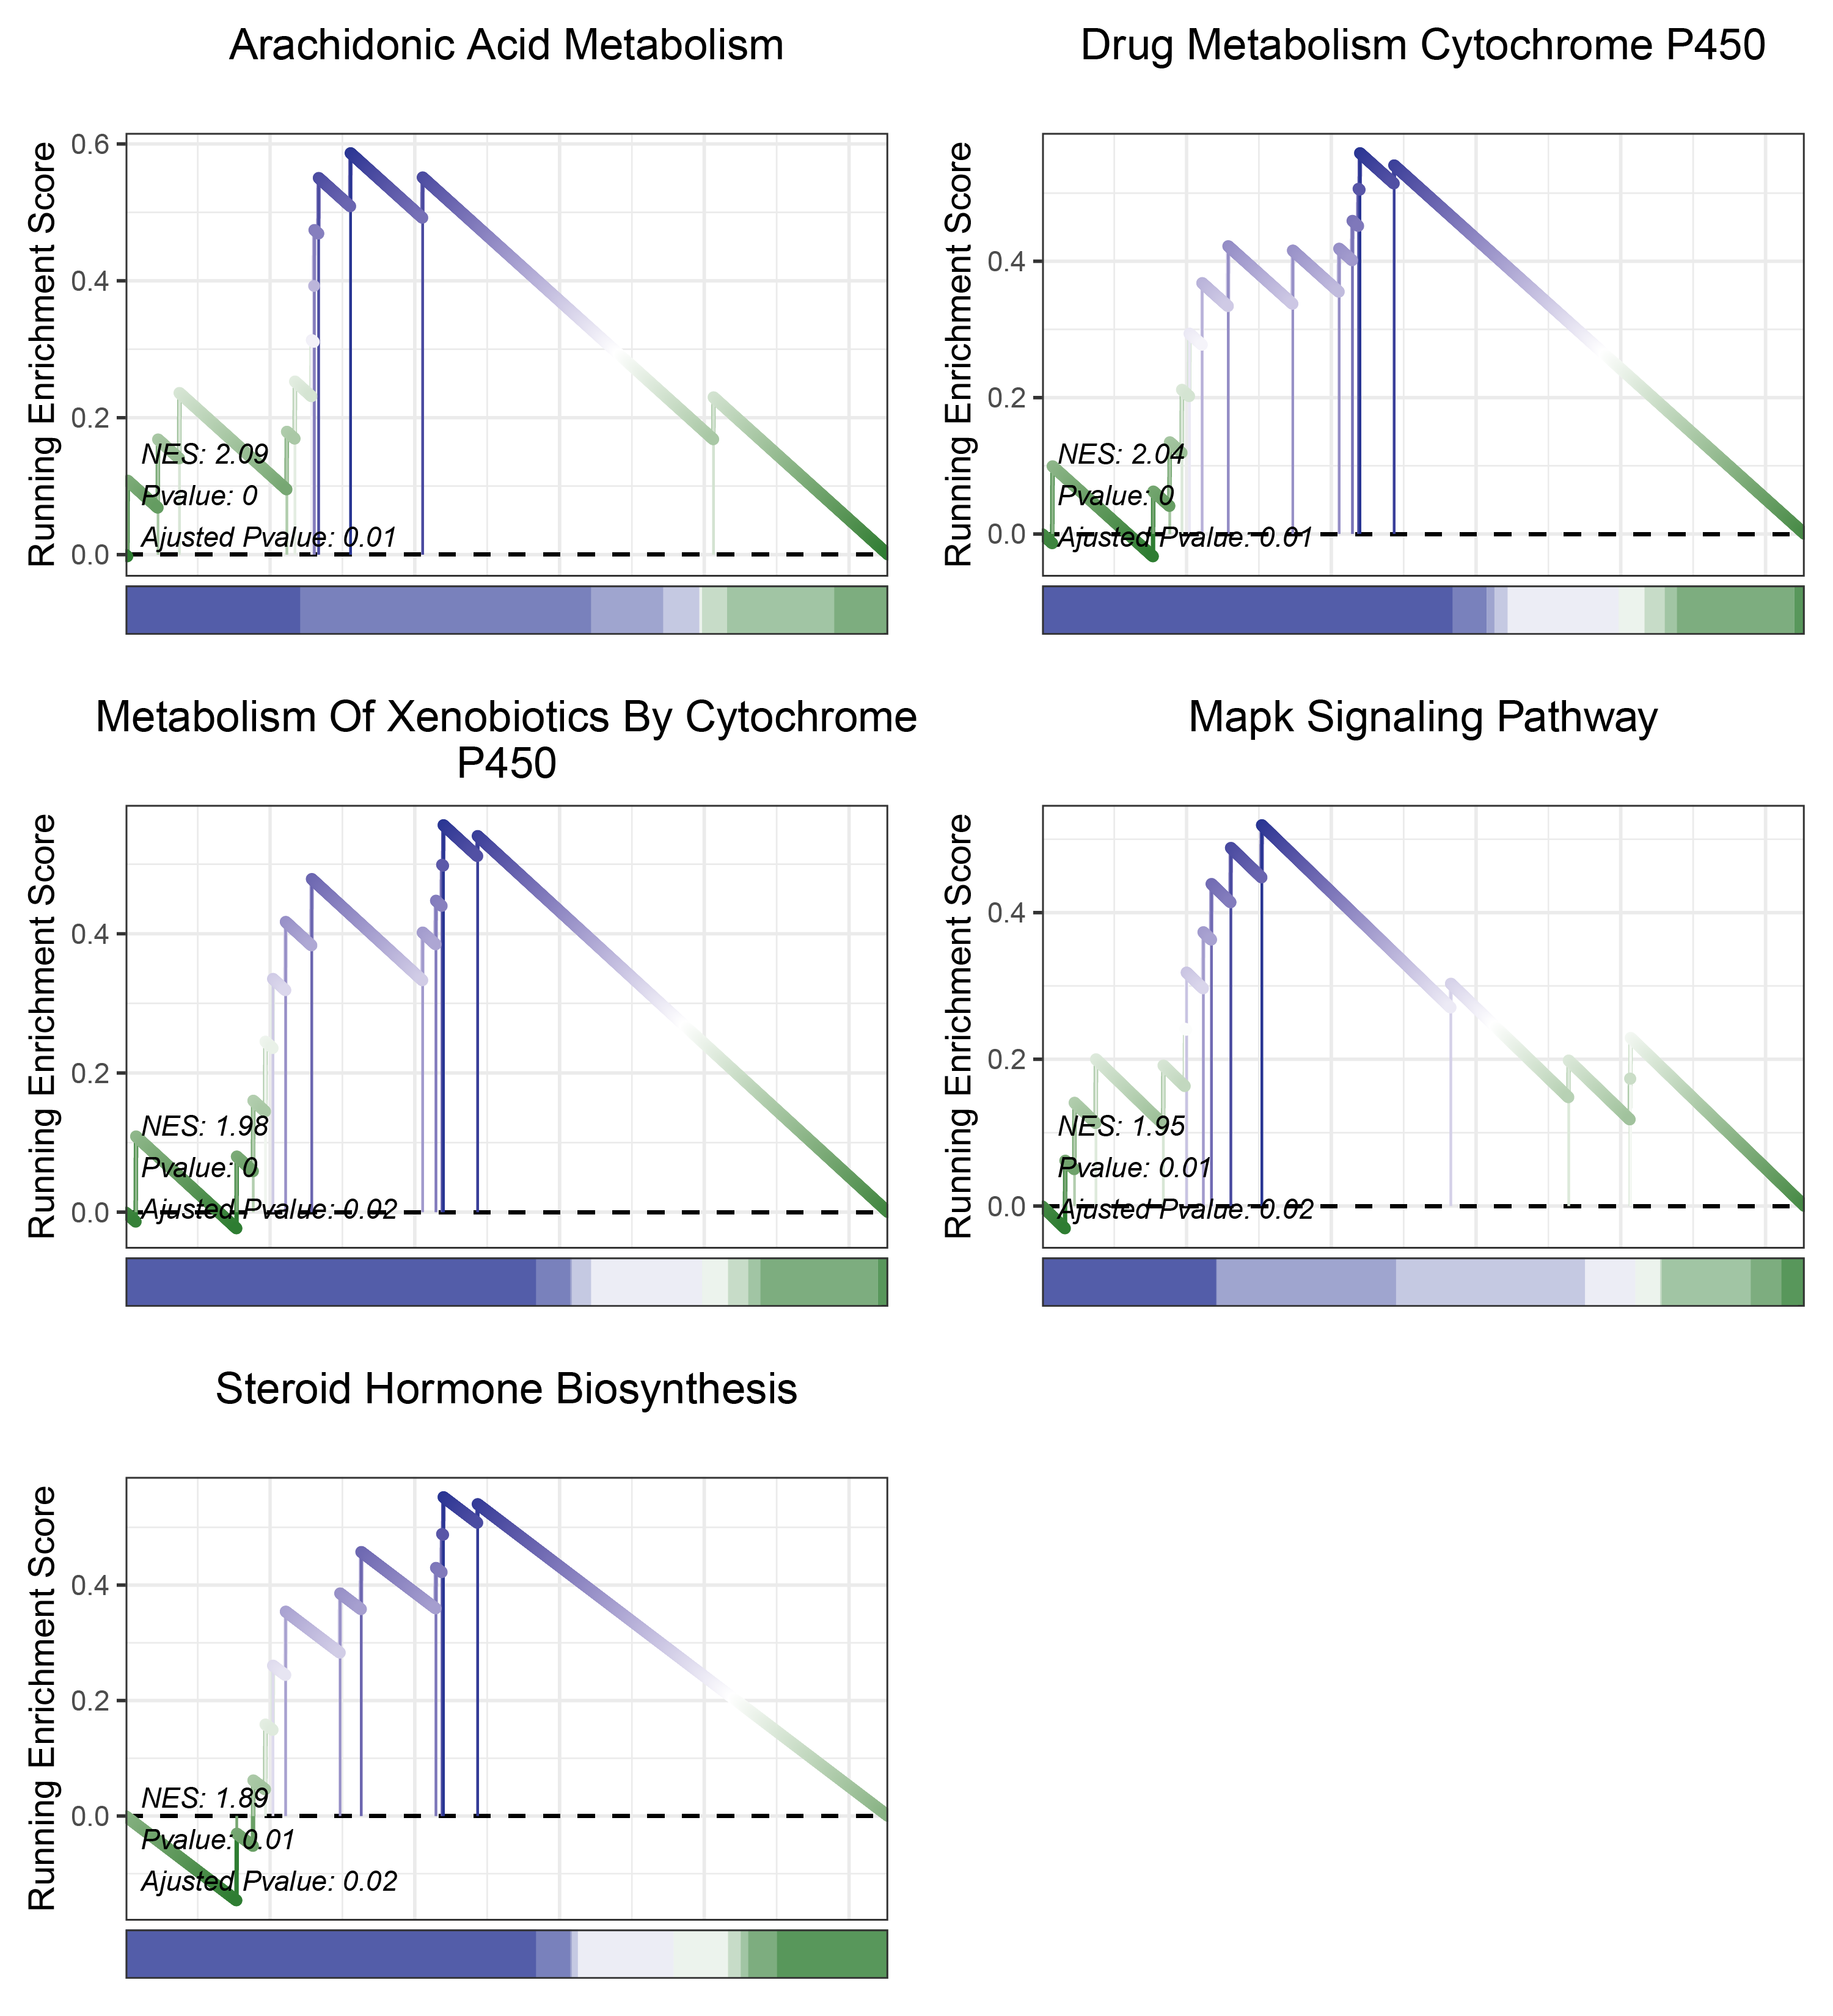
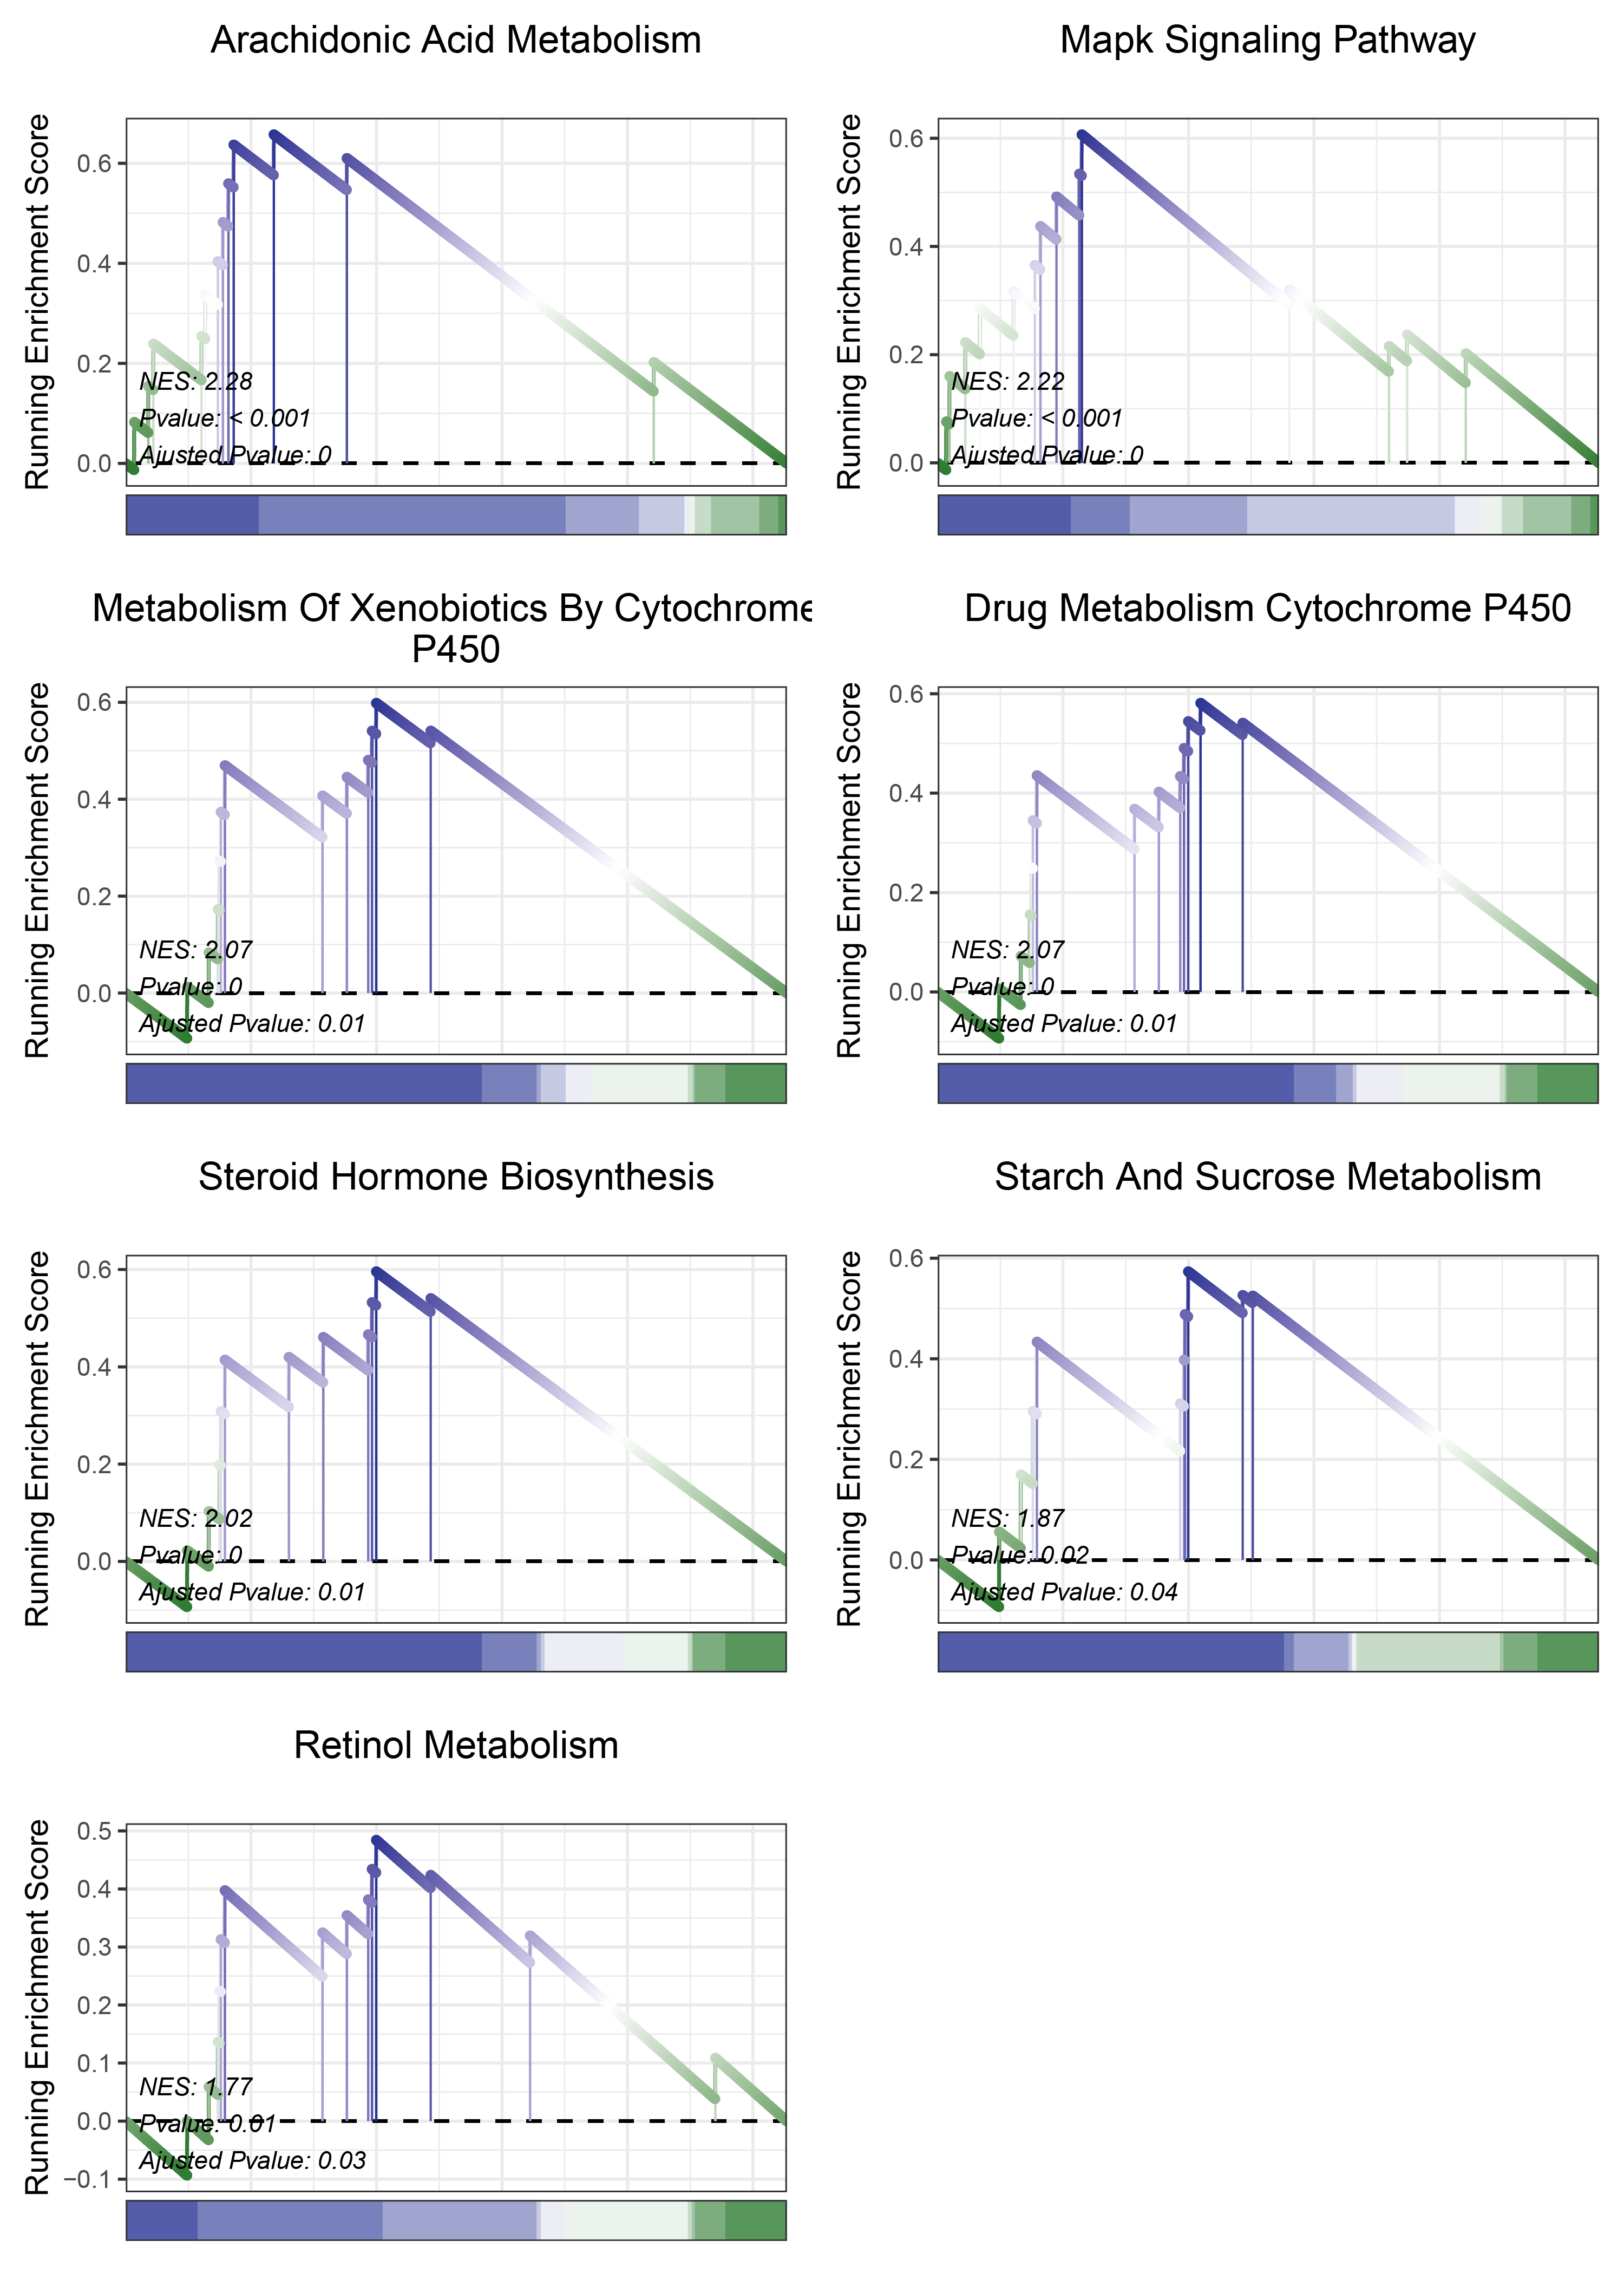
17.1.6 edgeR KEGG
print(edgeR_CFD_kegg_y@result$ID)

# plot
geneSetID = c("Arachidonic Acid Metabolism",
              "Drug Metabolism Cytochrome P450",
              "Metabolism Of Xenobiotics By Cytochrome P450",
              "Mapk Signaling Pathway",
              "Steroid Hormone Biosynthesis")

lapply(geneSetID, function(x){
  gseaNb(object = edgeR_CFD_kegg_y,
          geneSetID = x,
          newGsea = T,
          addPval = T,
          pvalX = 0.02,pvalY = 0.1,
          pCol = 'black',
          pHjust = 0,
          subPlot = 2,newCurveCol = c("#2e7d32", "white", "#283593"),
          newHtCol = c("#283593", "white", "#2e7d32"))
}) -> gseaList1

# combine
cowplot::plot_grid(plotlist = gseaList1,ncol = 2,align = 'hv')
edgeR_CFD_kegg
17.1.7 limma HALLMARKS
print(limma_CFD_hallmarks_y@result$ID)

# plot
geneSetID = c("Estrogen Response Late",
              "Adipogenesis",
              "P53 Pathway",
              "Myogenesis",
              "Apical Junction",
              "Mtorc1 Signaling",
              "Complement",
              "Spermatogenesis",
              "Inflammatory Response",
              "Interferon Gamma Response",
              "Allograft Rejection",
              "E2f Targets",
              "G2m Checkpoint")

lapply(geneSetID, function(x){
  gseaNb(object = limma_CFD_hallmarks_y,
          geneSetID = x,
          newGsea = T,
          addPval = T,
          pvalX = 0.02,pvalY = 0.1,
          pCol = 'black',
          pHjust = 0,
          subPlot = 2,newCurveCol = c("#558b2f", "white", "#1565c0"),
          newHtCol = c("#1565c0", "white", "#558b2f"))
}) -> gseaList1

# combine
cowplot::plot_grid(plotlist = gseaList1,ncol = 2,align = 'hv')
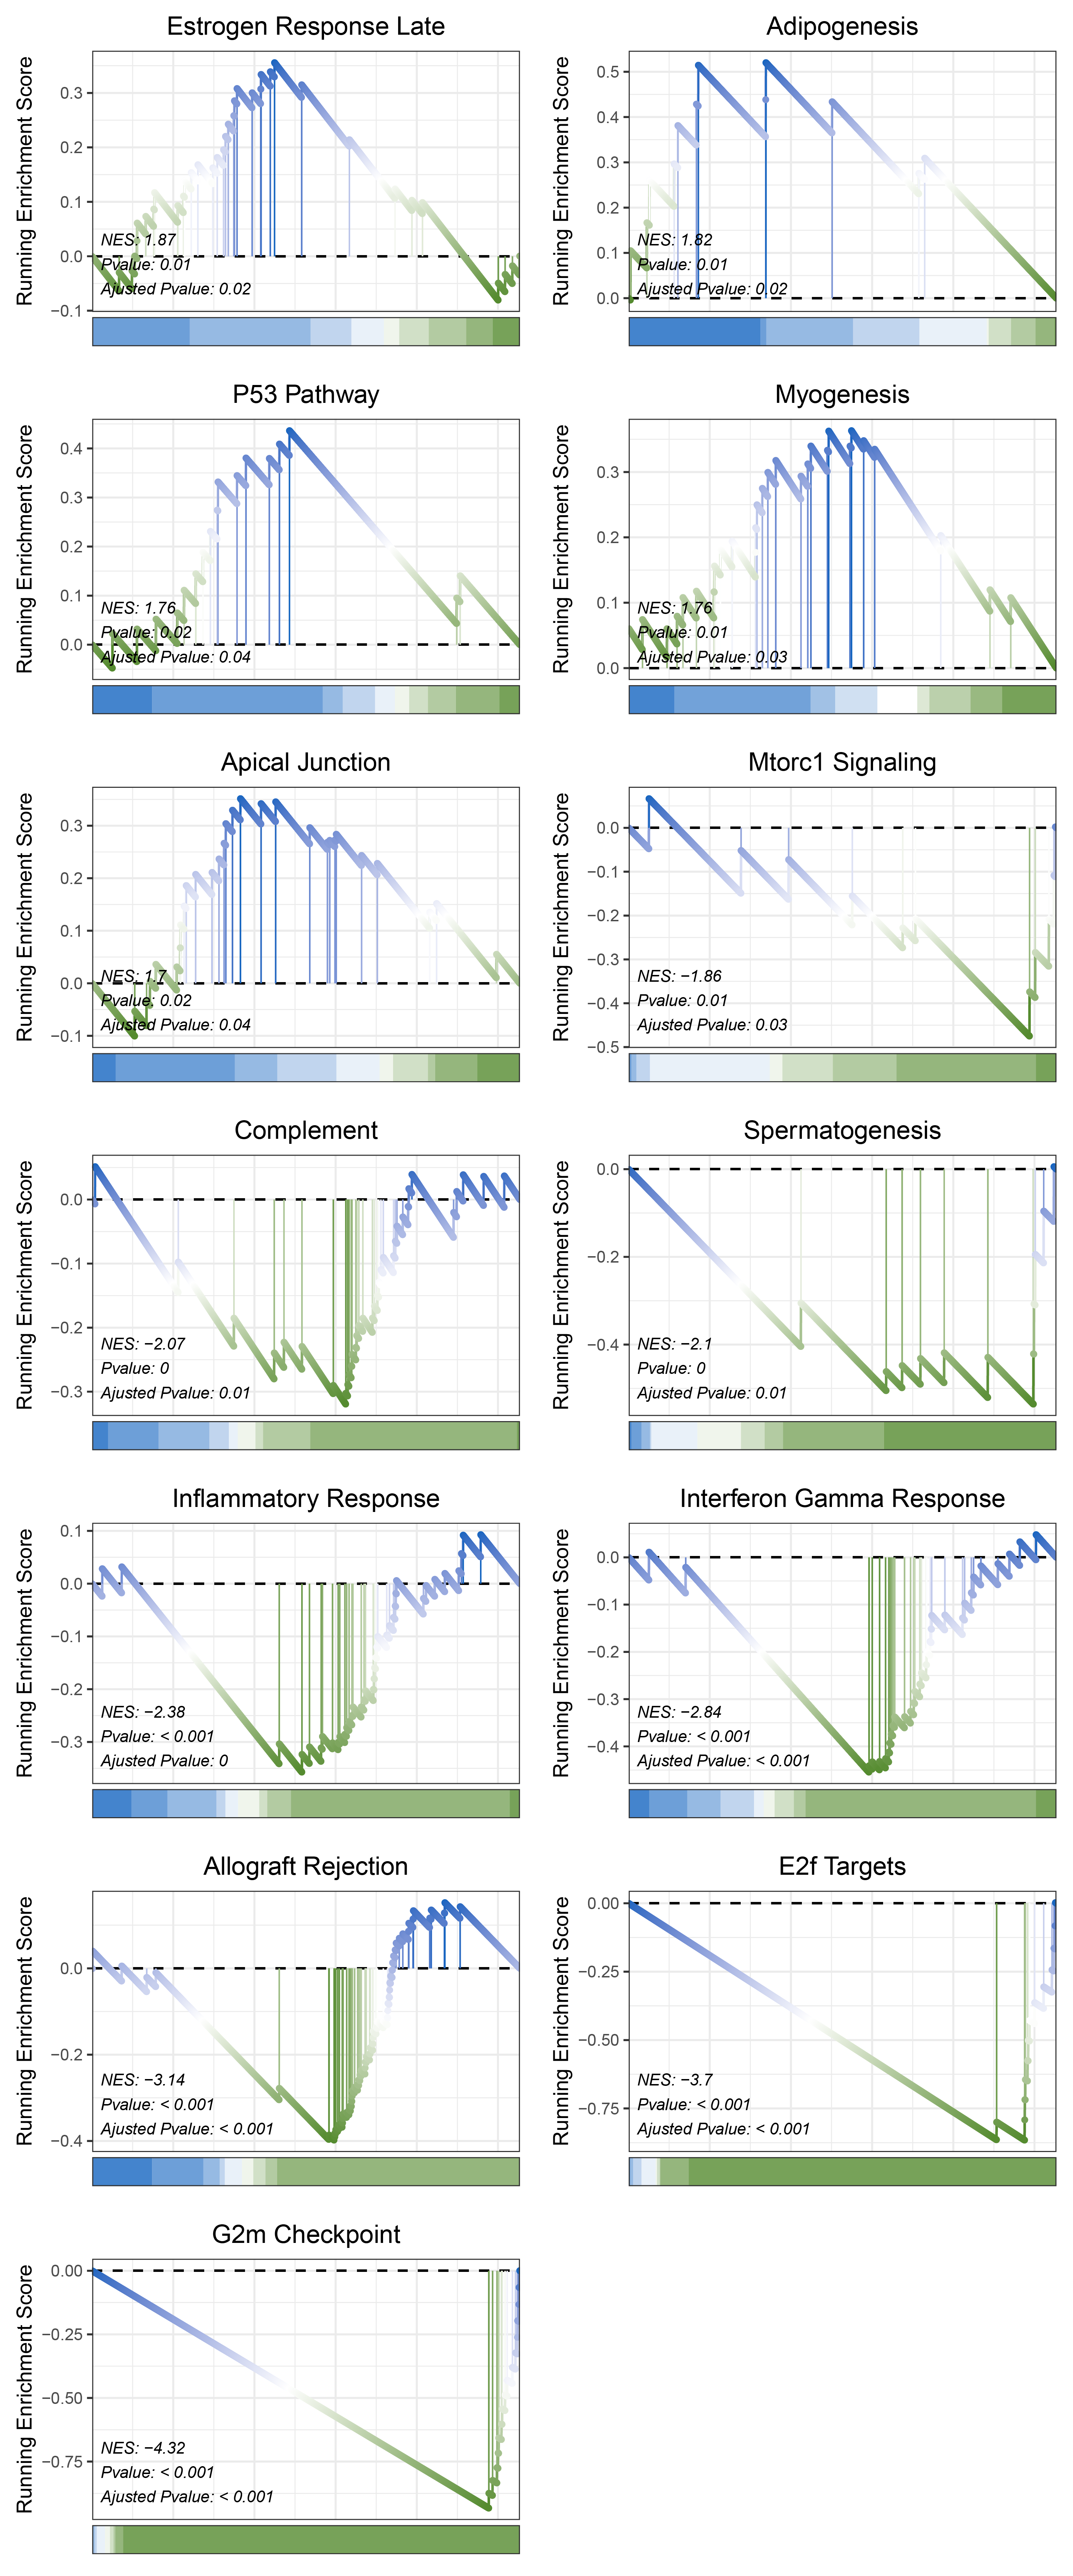
limma_CFD_hallmarks
17.1.8 limma KEGG
print(limma_CFD_kegg_y@result$ID)

# plot
geneSetID = c("Arachidonic Acid Metabolism",
              "Steroid Hormone Biosynthesis",
              "Metabolism Of Xenobiotics By Cytochrome P450",
              "Chemokine Signaling Pathway",
              "Systemic Lupus Erythematosus",
              "Primary Immunodeficiency",
              "Leishmania Infection",
              "Hematopoietic Cell Lineage",
              "Allograft Rejection",
              "Graft Versus Host Disease",
              "Autoimmune Thyroid Disease",
              "Type I Diabetes Mellitus")

lapply(geneSetID, function(x){
  gseaNb(object = limma_CFD_kegg_y,
          geneSetID = x,
          newGsea = T,
          addPval = T,
          pvalX = 0.02,pvalY = 0.1,
          pCol = 'black',
          pHjust = 0,
          subPlot = 2,newCurveCol = c("#558b2f", "white", "#1565c0"),
          newHtCol = c("#1565c0", "white", "#558b2f"))
}) -> gseaList1

# combine
cowplot::plot_grid(plotlist = gseaList1,ncol = 2,align = 'hv')
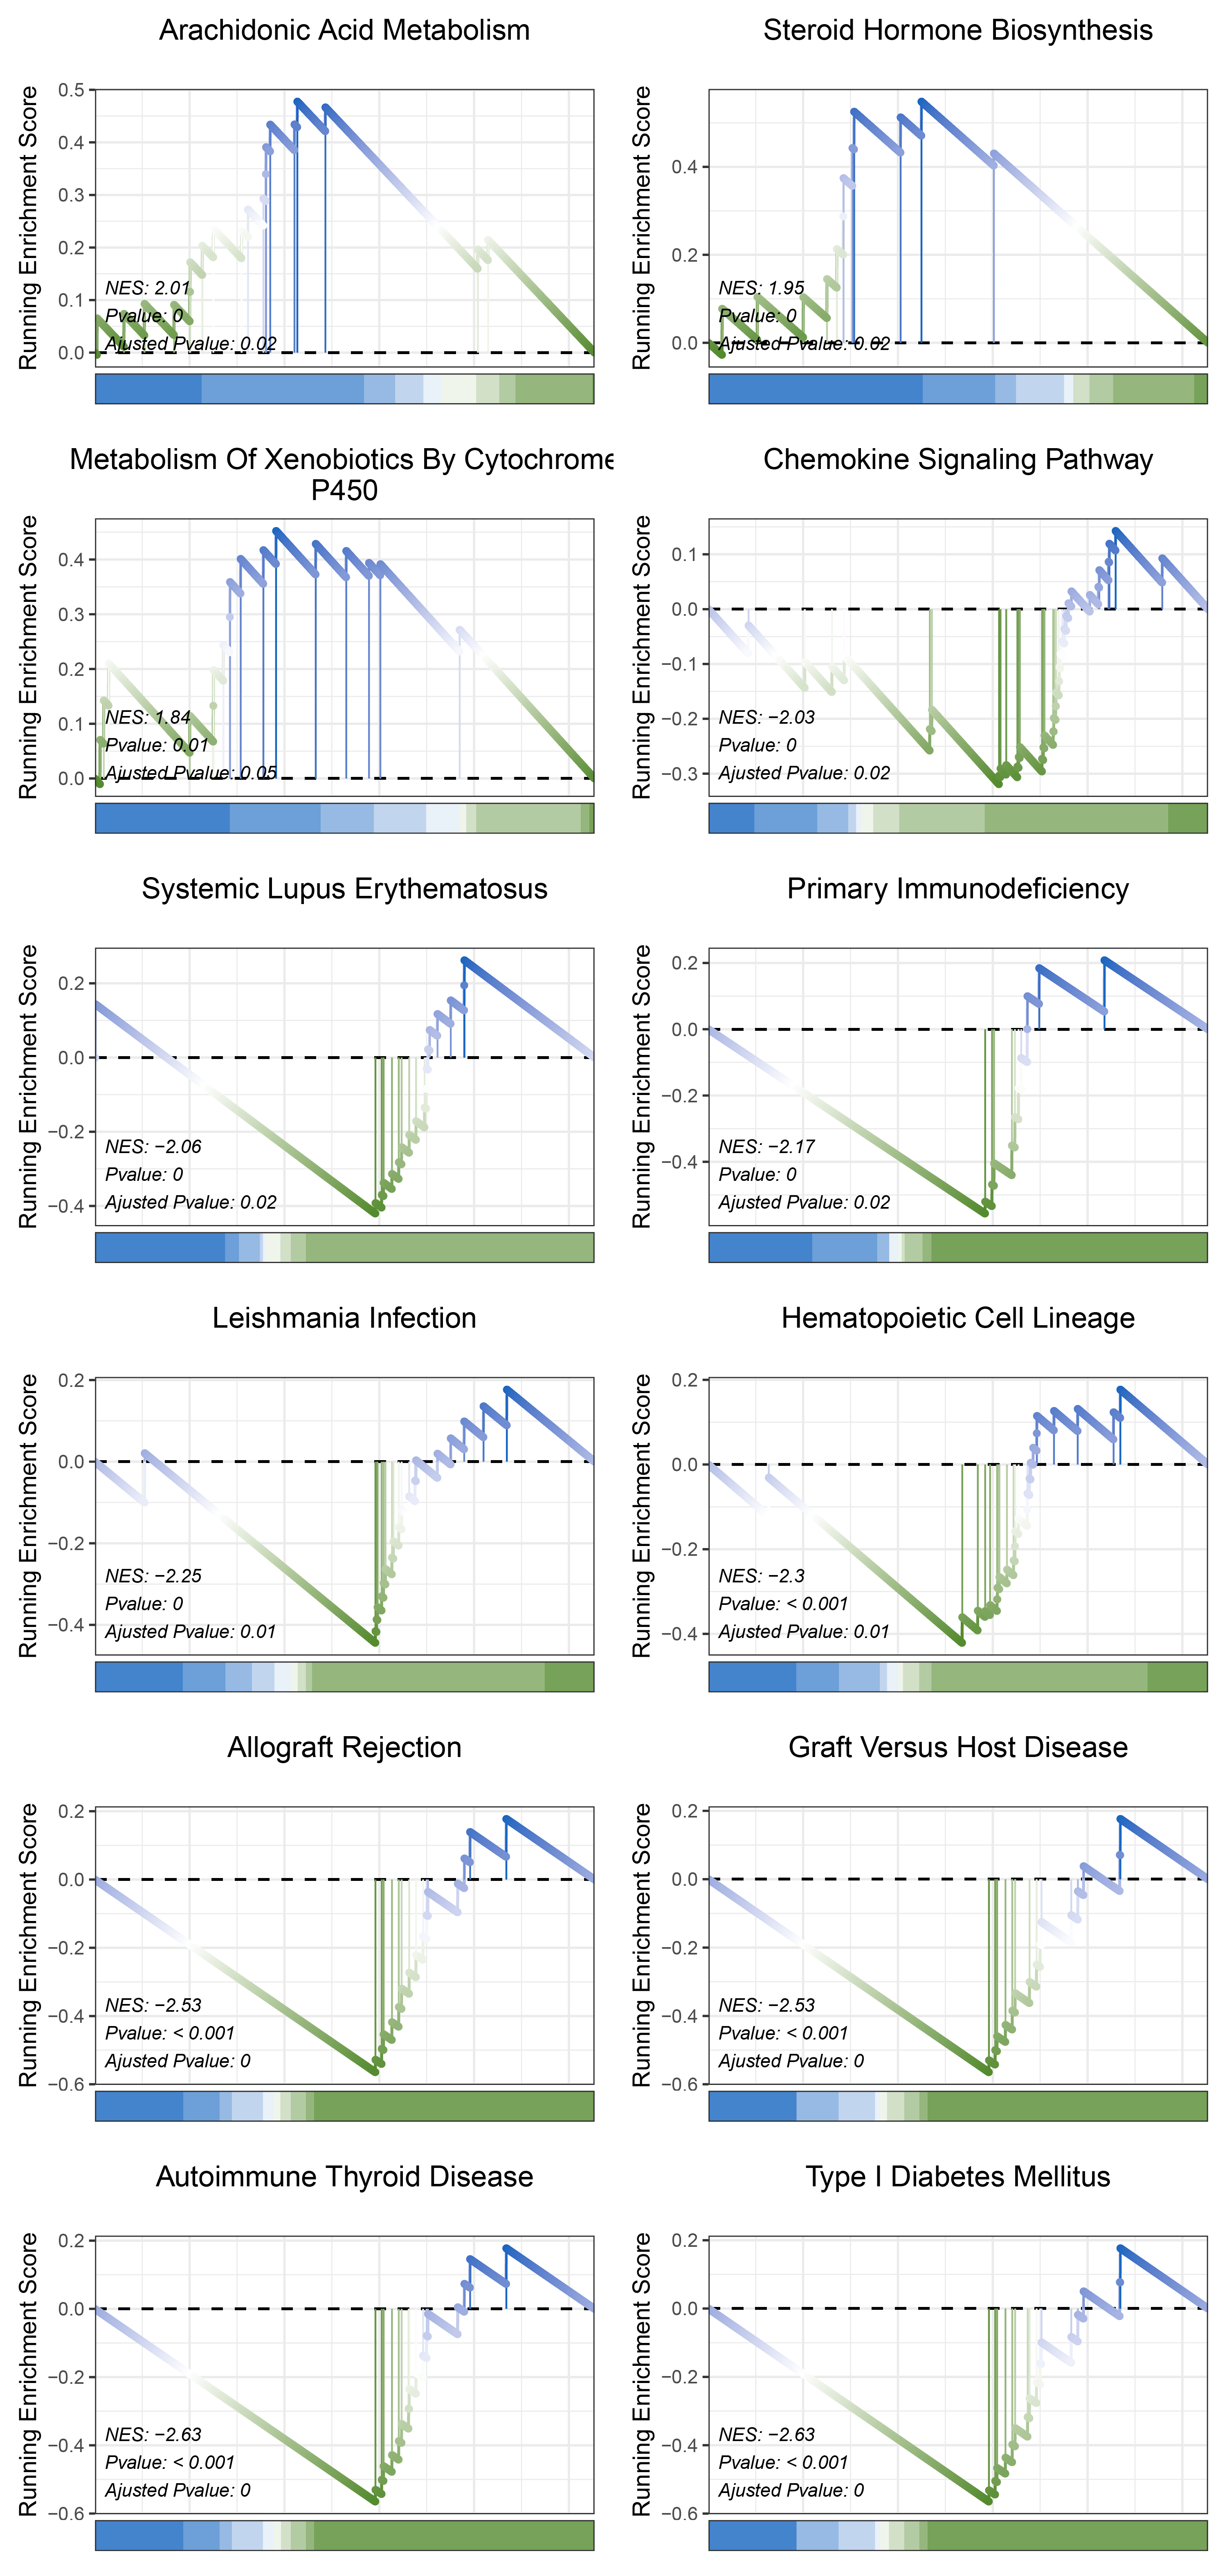
limma_CFD_kegg
17.1.9 outRst HALLMARKS
print(outRst_CFD_hallmarks_y@result$ID)

# plot
geneSetID = c("Estrogen Response Late",
              "Il2 Stat5 Signaling",
              "Inflammatory Response",
              "Complement",
              "Interferon Alpha Response",
              "Il6 Jak Stat3 Signaling",
              "Interferon Gamma Response",
              "Allograft Rejection")

lapply(geneSetID, function(x){
  gseaNb(object = outRst_CFD_hallmarks_y,
          geneSetID = x,
          newGsea = T,
          addPval = T,
          pvalX = 0.02,pvalY = 0.1,
          pCol = 'black',
          pHjust = 0,
          subPlot = 2,newCurveCol = c("#9e9d24", "white", "#0277bd"),
          newHtCol = c("#0277bd", "white", "#9e9d24"))
}) -> gseaList1

# combine
cowplot::plot_grid(plotlist = gseaList1,ncol = 2,align = 'hv')
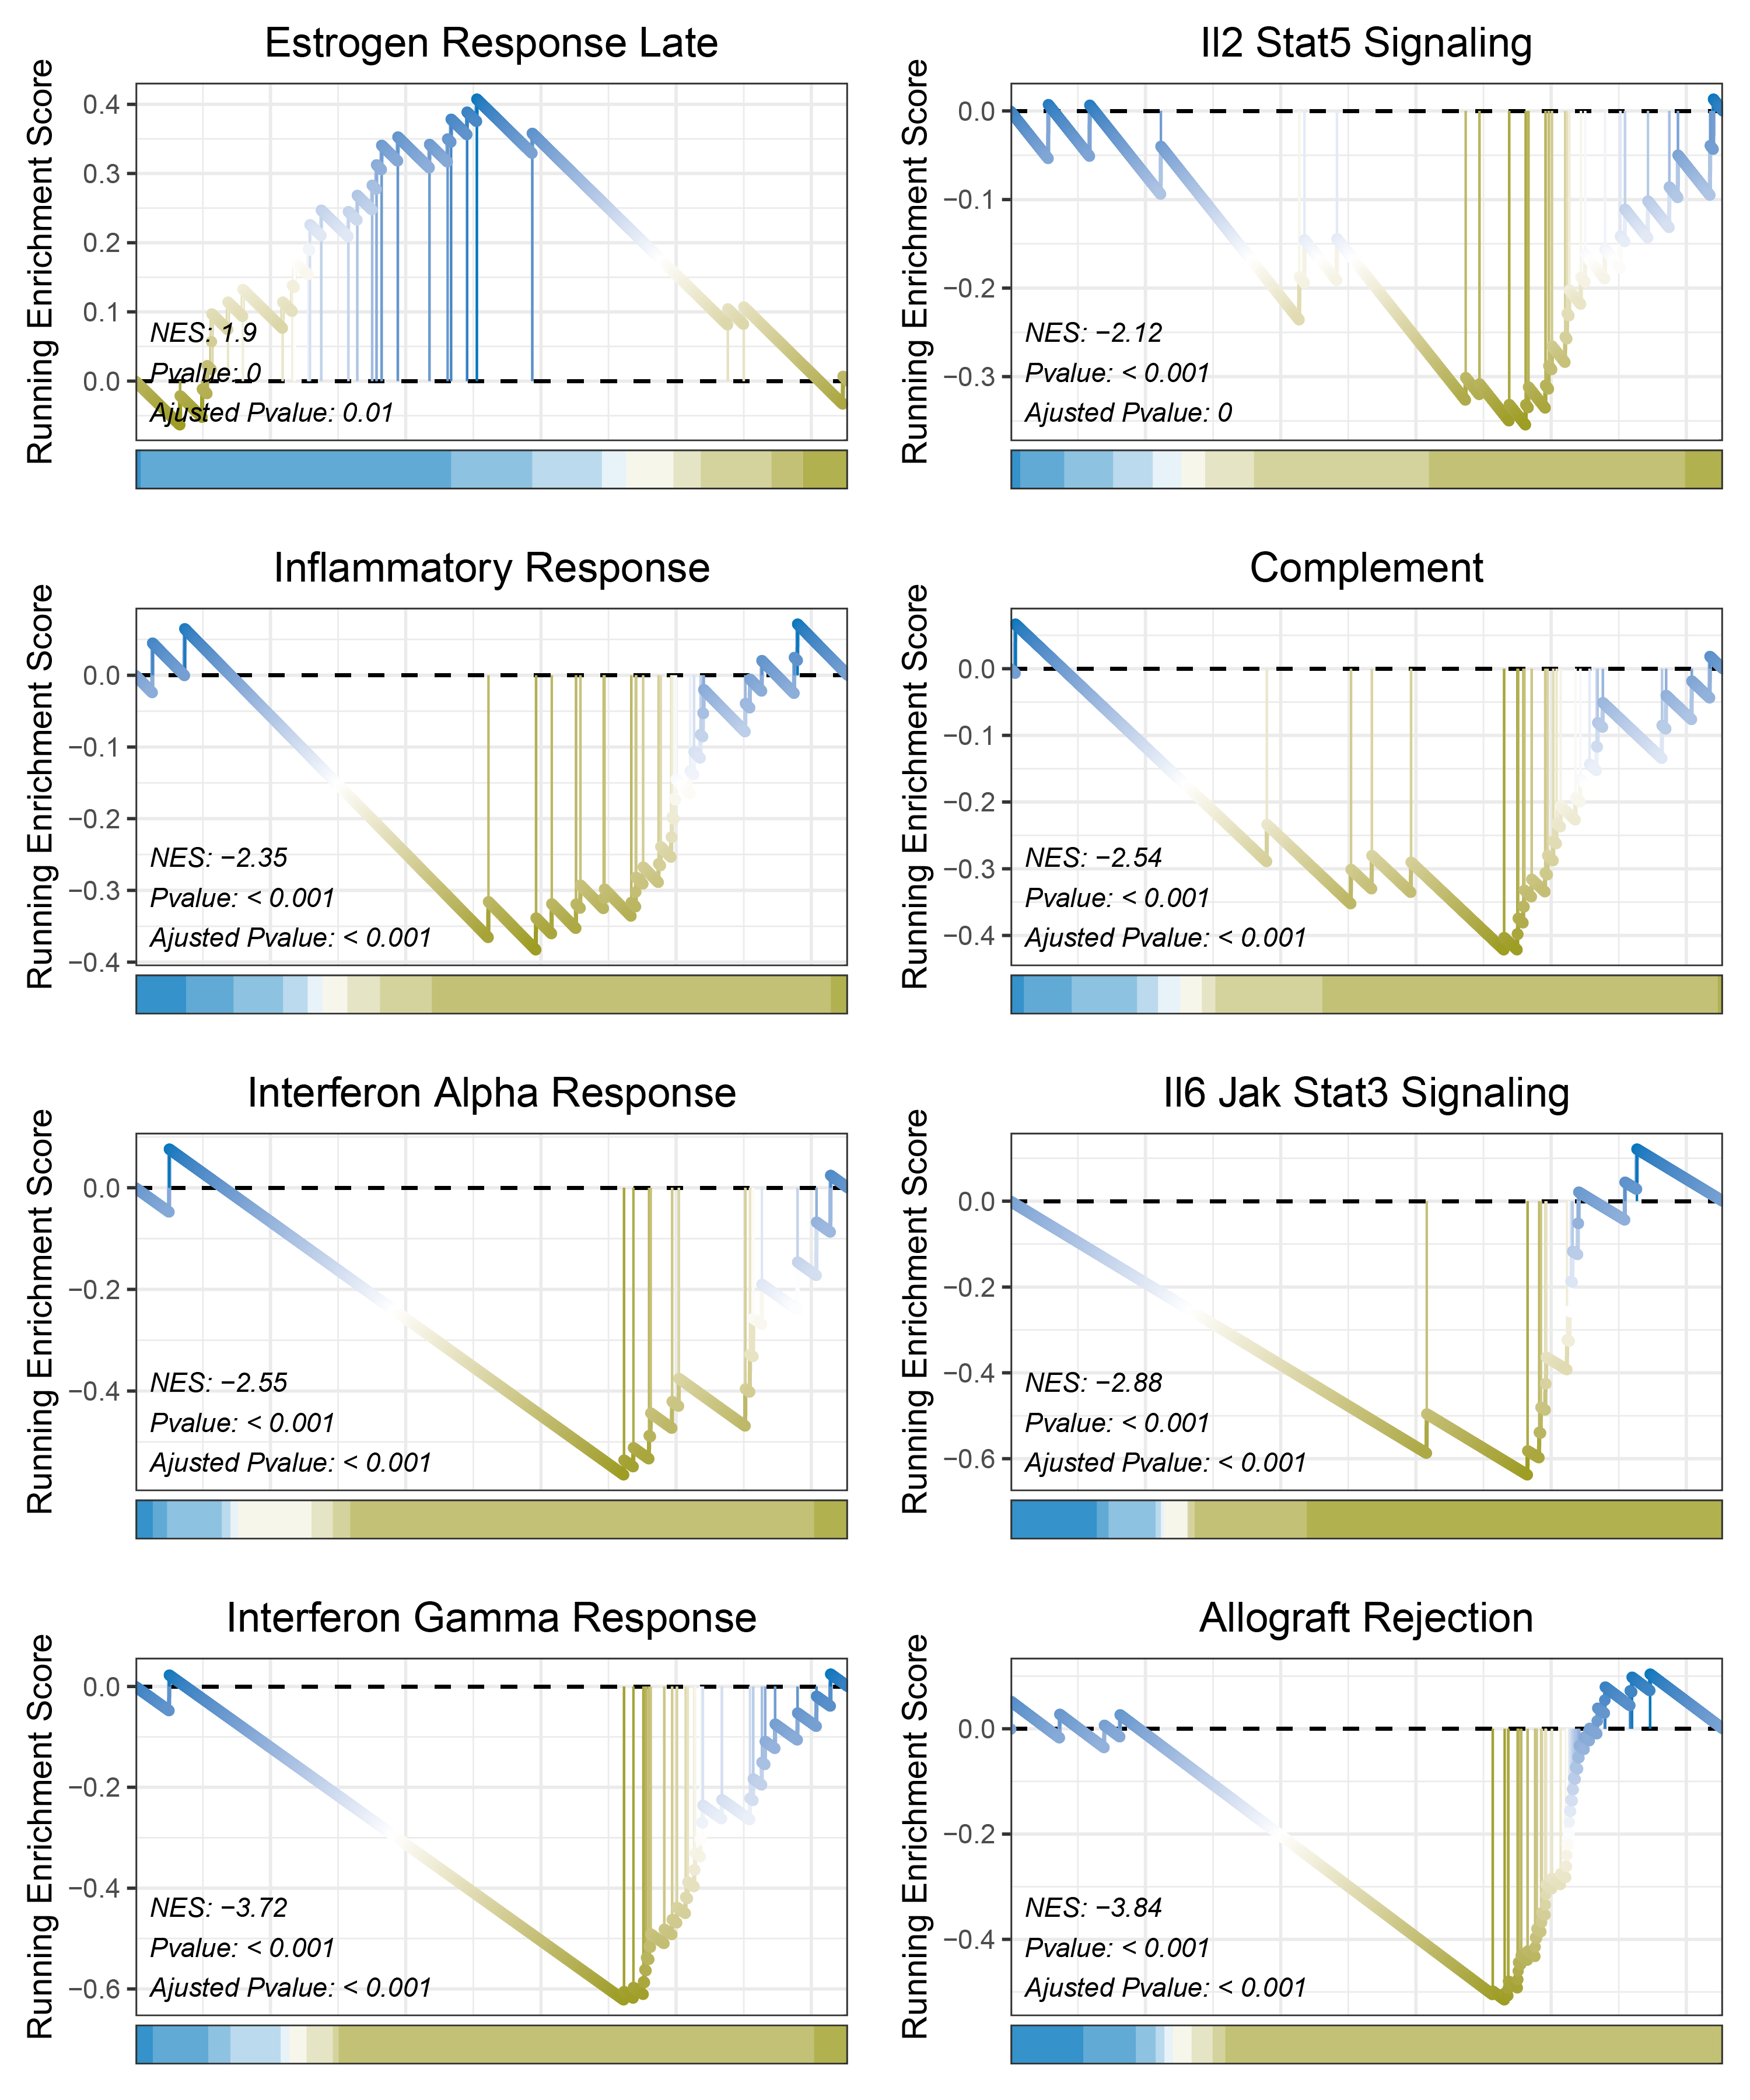
outRst_CFD_hallmarks
17.1.10 outRst KEGG
print(outRst_CFD_kegg_y@result$ID)

# plot
geneSetID = c("Steroid Hormone Biosynthesis",
              "Toll Like Receptor Signaling Pathway",
              "Leishmania Infection",
              "Antigen Processing And Presentation",
              "Cell Adhesion Molecules Cams",
              "Hematopoietic Cell Lineage",
              "Natural Killer Cell Mediated Cytotoxicity",
              "Autoimmune Thyroid Disease",
              "Systemic Lupus Erythematosus",
              "Chemokine Signaling Pathway",
              "Allograft Rejection",
              "Graft Versus Host Disease",
              "Type I Diabetes Mellitus")

lapply(geneSetID, function(x){
  gseaNb(object = outRst_CFD_kegg_y,
          geneSetID = x,
          newGsea = T,
          addPval = T,
          pvalX = 0.02,pvalY = 0.1,
          pCol = 'black',
          pHjust = 0,
          subPlot = 2,newCurveCol = c("#9e9d24", "white", "#0277bd"),
          newHtCol = c("#0277bd", "white", "#9e9d24"))
}) -> gseaList1

# combine
cowplot::plot_grid(plotlist = gseaList1,ncol = 2,align = 'hv')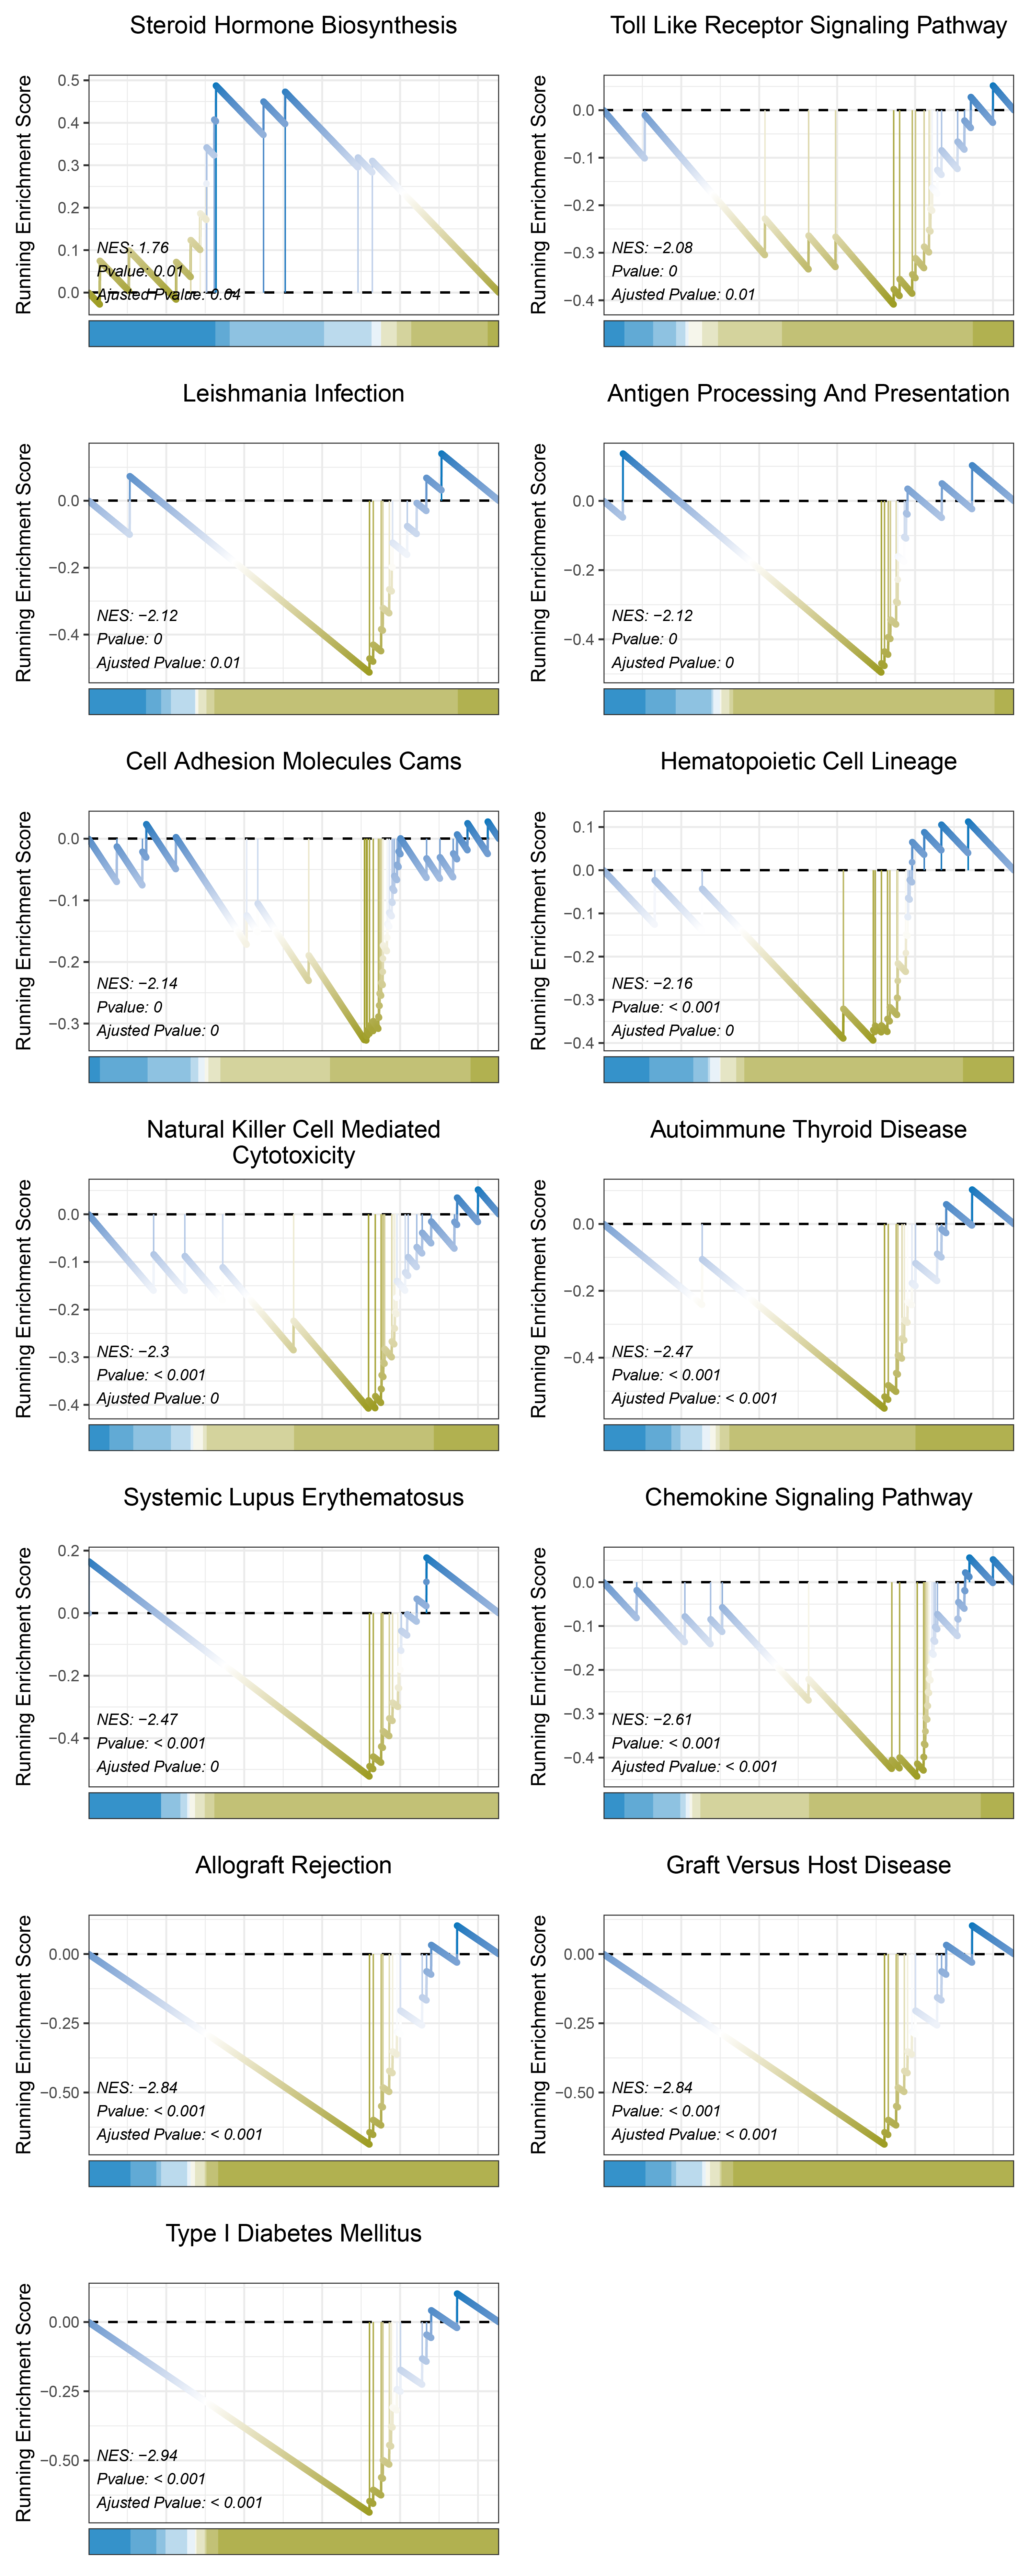
outRst_CFD_kegg
17.2 ANKRD35
17.2.1 TransPropy HALLMARKS
print(TransPropy_ANKRD35_hallmarks_y@result$ID)

# plot
geneSetID = c("Xenobiotic Metabolism",
                          "Kras Signaling Dn",
                          "Myogenesis",
                          "Apical Junction",
                          "Tnfa Signaling Via Nfkb",
                          "Il2 Stat5 Signaling",
                          "Spermatogenesis",
                          "Interferon Gamma Response",
                          "Allograft Rejection",
                          "Mitotic Spindle",
                          "E2f Targets",
                          "G2m Checkpoint")

lapply(geneSetID, function(x){
  gseaNb(object = TransPropy_ANKRD35_hallmarks_y,
          geneSetID = x,
          newGsea = T,
          addPval = T,
          pvalX = 0.02,pvalY = 0.1,
          pCol = 'black',
          pHjust = 0,
          subPlot = 2,newCurveCol = c("#00838f", "white", "#6a1b9a"),
          newHtCol = c("#6a1b9a", "white", "#00838f"))
}) -> gseaList1

# combine
cowplot::plot_grid(plotlist = gseaList1,ncol = 2,align = 'hv')![]()
TransPropy_ANKRD35_hallmarks
17.2.2 TransPropy KEGG
print(TransPropy_ANKRD35_kegg_y@result$ID)

# plot
geneSetID = c("Metabolism Of Xenobiotics By Cytochrome P450",
                          "Arachidonic Acid Metabolism",
                          "Drug Metabolism Cytochrome P450",
                          "Retinol Metabolism",
                          "Endocytosis",
                          "Calcium Signaling Pathway",
                          "Mapk Signaling Pathway",
                          "Vascular Smooth Muscle Contraction",
                          "Ppar Signaling Pathway",
                          "Type I Diabetes Mellitus",
                          "Graft Versus Host Disease",
                          "Leishmania Infection",
                          "Hematopoietic Cell Lineage",
                          "Cell Cycle")

lapply(geneSetID, function(x){
  gseaNb(object = TransPropy_ANKRD35_kegg_y,
          geneSetID = x,
          newGsea = T,
          addPval = T,
          pvalX = 0.02,pvalY = 0.1,
          pCol = 'black',
          pHjust = 0,
          subPlot = 2,newCurveCol = c("#00838f", "white", "#6a1b9a"),
          newHtCol = c("#6a1b9a", "white", "#00838f"))
}) -> gseaList1

# combine
cowplot::plot_grid(plotlist = gseaList1,ncol = 2,align = 'hv')
![]()
TransPropy_ANKRD35_kegg
17.2.3 deseq2 HALLMARKS
print(deseq2_ANKRD35_hallmarks_y@result$ID)

# plot
geneSetID = c("Estrogen Response Late",
                          "Apical Junction",
                          "Kras Signaling Dn",
                          "P53 Pathway",
                          "Estrogen Response Early",
                          "Myogenesis",
                          "Hypoxia",
                          "Allograft Rejection")

lapply(geneSetID, function(x){
  gseaNb(object = deseq2_ANKRD35_hallmarks_y,
          geneSetID = x,
          newGsea = T,
          addPval = T,
          pvalX = 0.02,pvalY = 0.1,
          pCol = 'black',
          pHjust = 0,
          subPlot = 2,newCurveCol = c("#00695c", "white", "#4527a0"),
          newHtCol = c("#4527a0", "white", "#00695c"))
}) -> gseaList1

# combine
cowplot::plot_grid(plotlist = gseaList1,ncol = 2,align = 'hv')
deseq2_ANKRD35_hallmarks
17.2.4 deseq2 KEGG
print(deseq2_ANKRD35_kegg_y@result$ID)

# plot
geneSetID = c("Arachidonic Acid Metabolism",
                          "Mapk Signaling Pathway",
                          "Gnrh Signaling Pathway",
                          "Linoleic Acid Metabolism",
                          "Metabolism Of Xenobiotics By Cytochrome P450",
                          "Drug Metabolism Cytochrome P450",
                          "Steroid Hormone Biosynthesis",
                          "Chemokine Signaling Pathway")

lapply(geneSetID, function(x){
  gseaNb(object = deseq2_ANKRD35_kegg_y,
          geneSetID = x,
          newGsea = T,
          addPval = T,
          pvalX = 0.02,pvalY = 0.1,
          pCol = 'black',
          pHjust = 0,
          subPlot = 2,newCurveCol = c("#00695c", "white", "#4527a0"),
          newHtCol = c("#4527a0", "white", "#00695c"))
}) -> gseaList1

# combine
cowplot::plot_grid(plotlist = gseaList1,ncol = 2,align = 'hv')
deseq2_ANKRD35_kegg
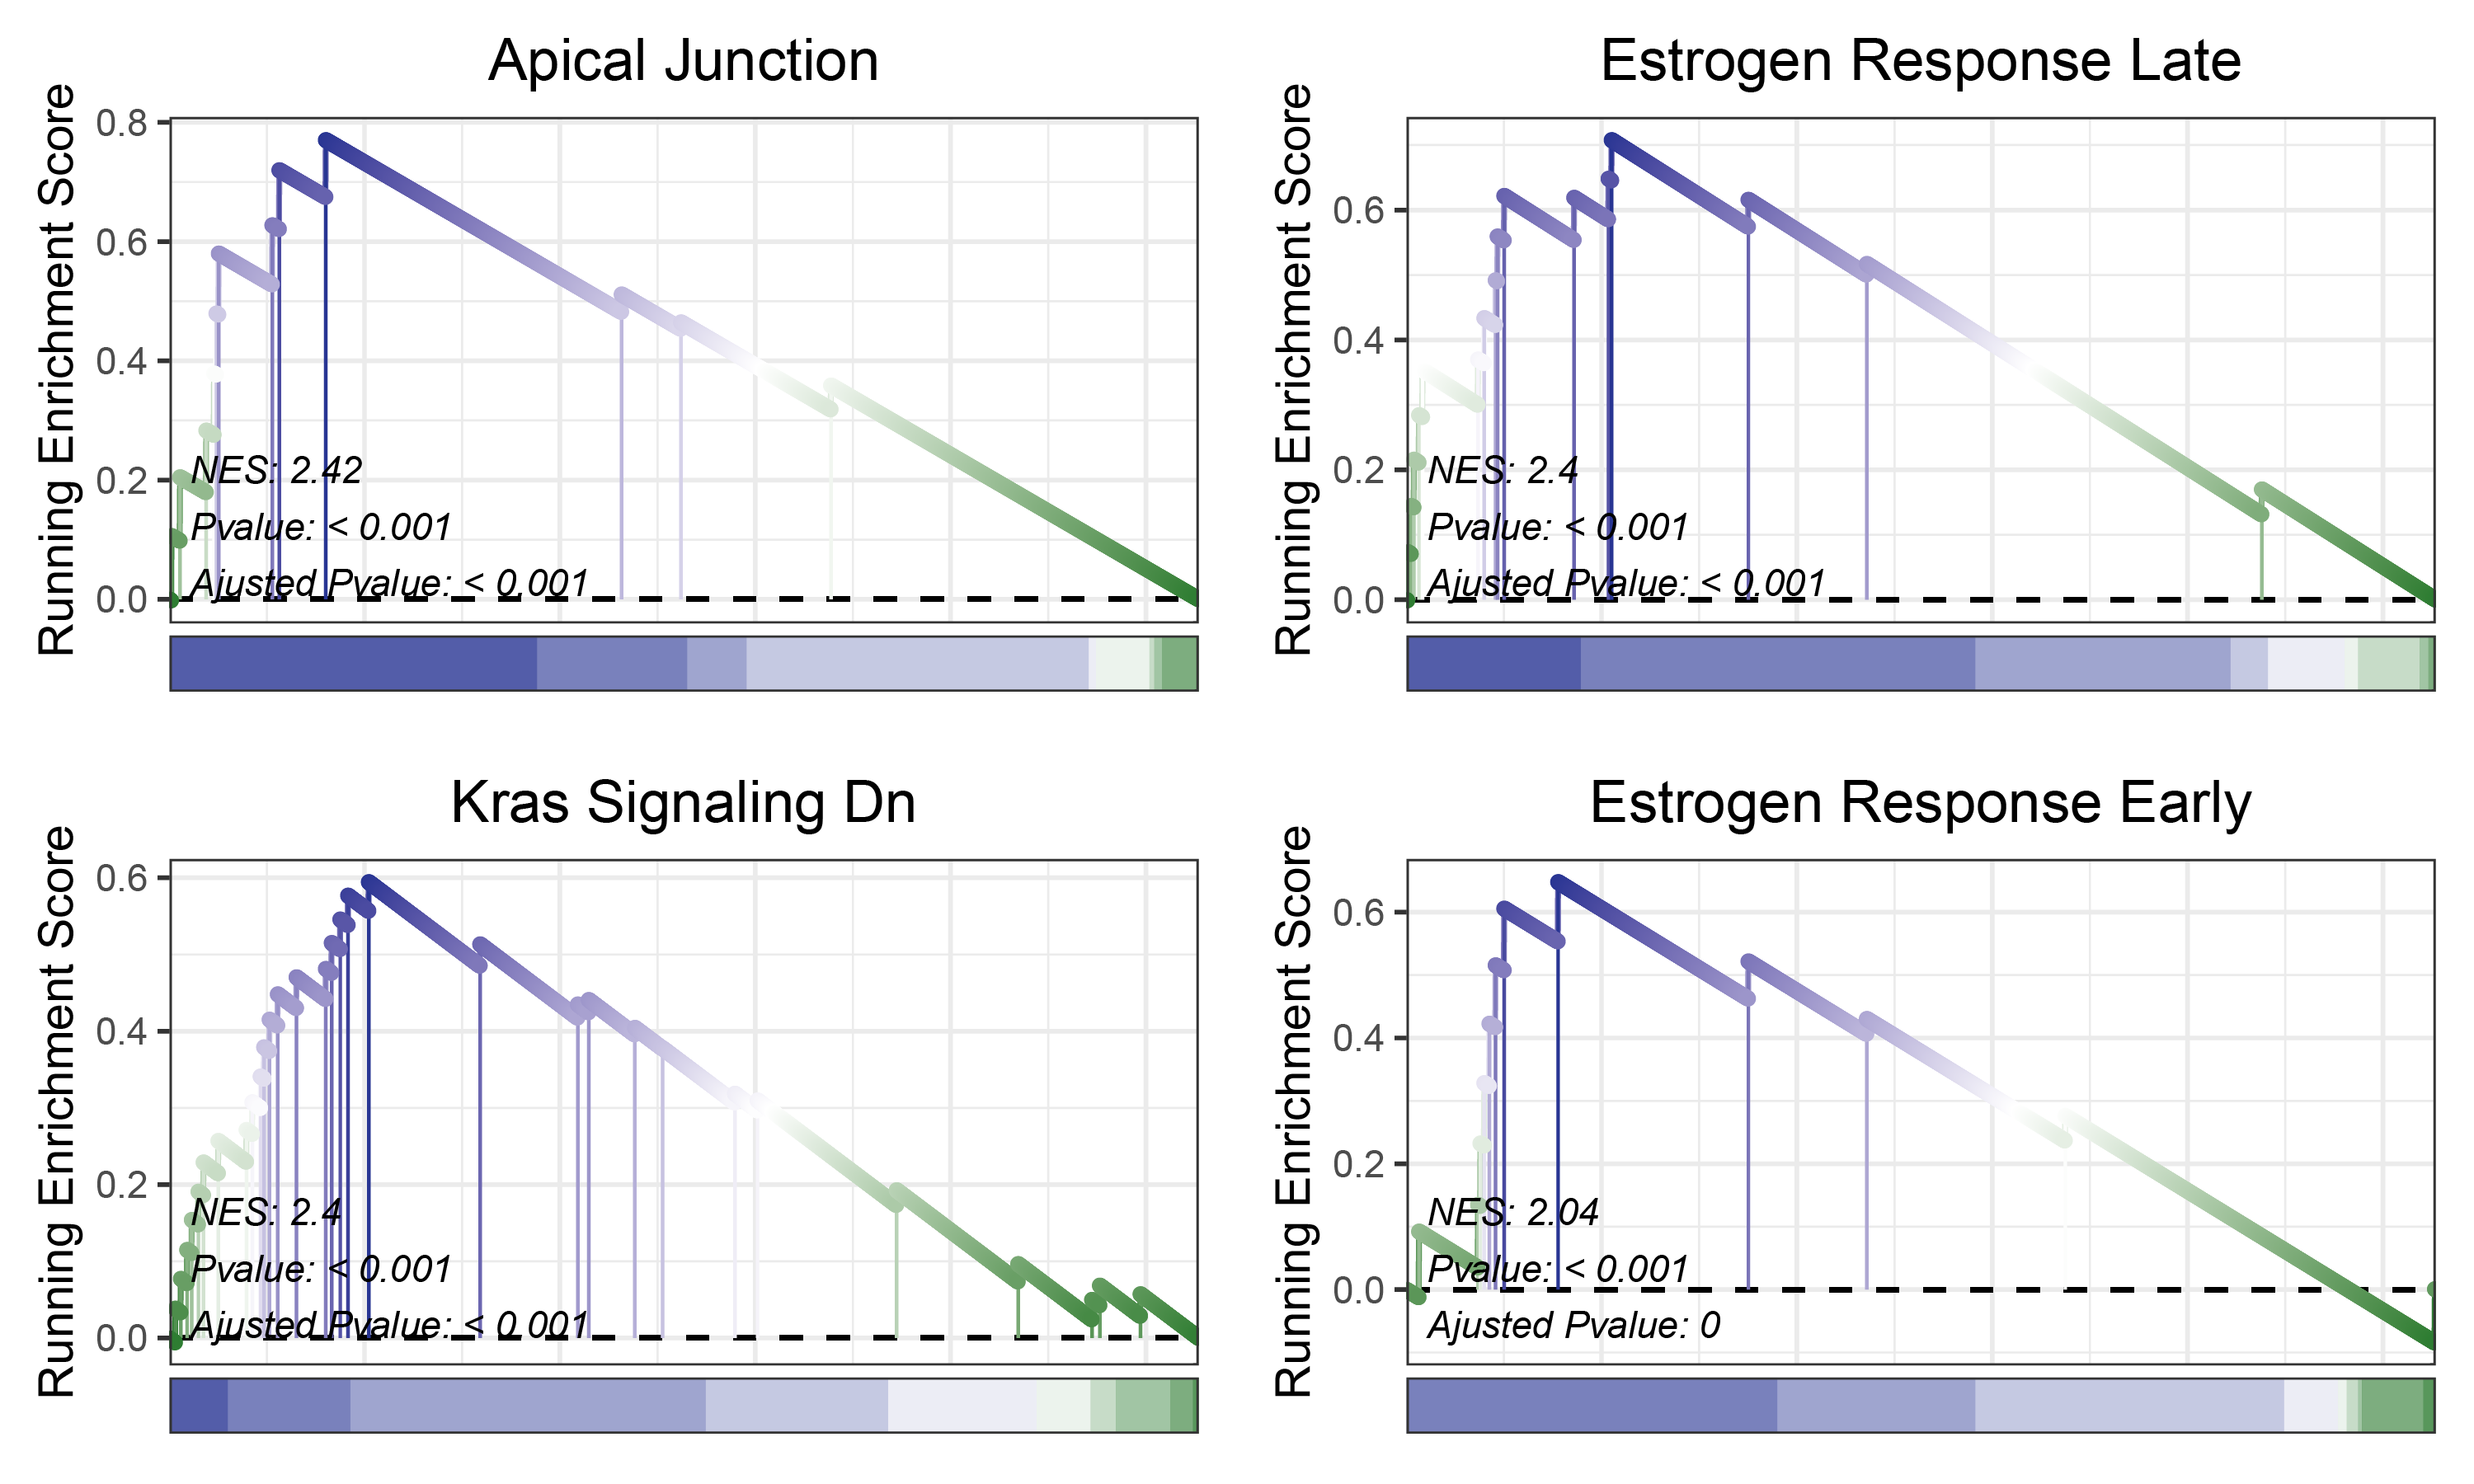
17.2.5 edgeR HALLMARKS
print(edgeR_ANKRD35_hallmarks_y@result$ID)

# plot
geneSetID = c("Estrogen Response Late",
              "Kras Signaling Dn",
              "Apical Junction",
              "Estrogen Response Early",
              "Allograft Rejection")

lapply(geneSetID, function(x){
  gseaNb(object = edgeR_ANKRD35_hallmarks_y,
          geneSetID = x,
          newGsea = T,
          addPval = T,
          pvalX = 0.02,pvalY = 0.1,
          pCol = 'black',
          pHjust = 0,
          subPlot = 2,newCurveCol = c("#2e7d32", "white", "#283593"),
          newHtCol = c("#283593", "white", "#2e7d32"))
}) -> gseaList1

# combine
cowplot::plot_grid(plotlist = gseaList1,ncol = 2,align = 'hv')
edgeR_ANKRD35_hallmarks
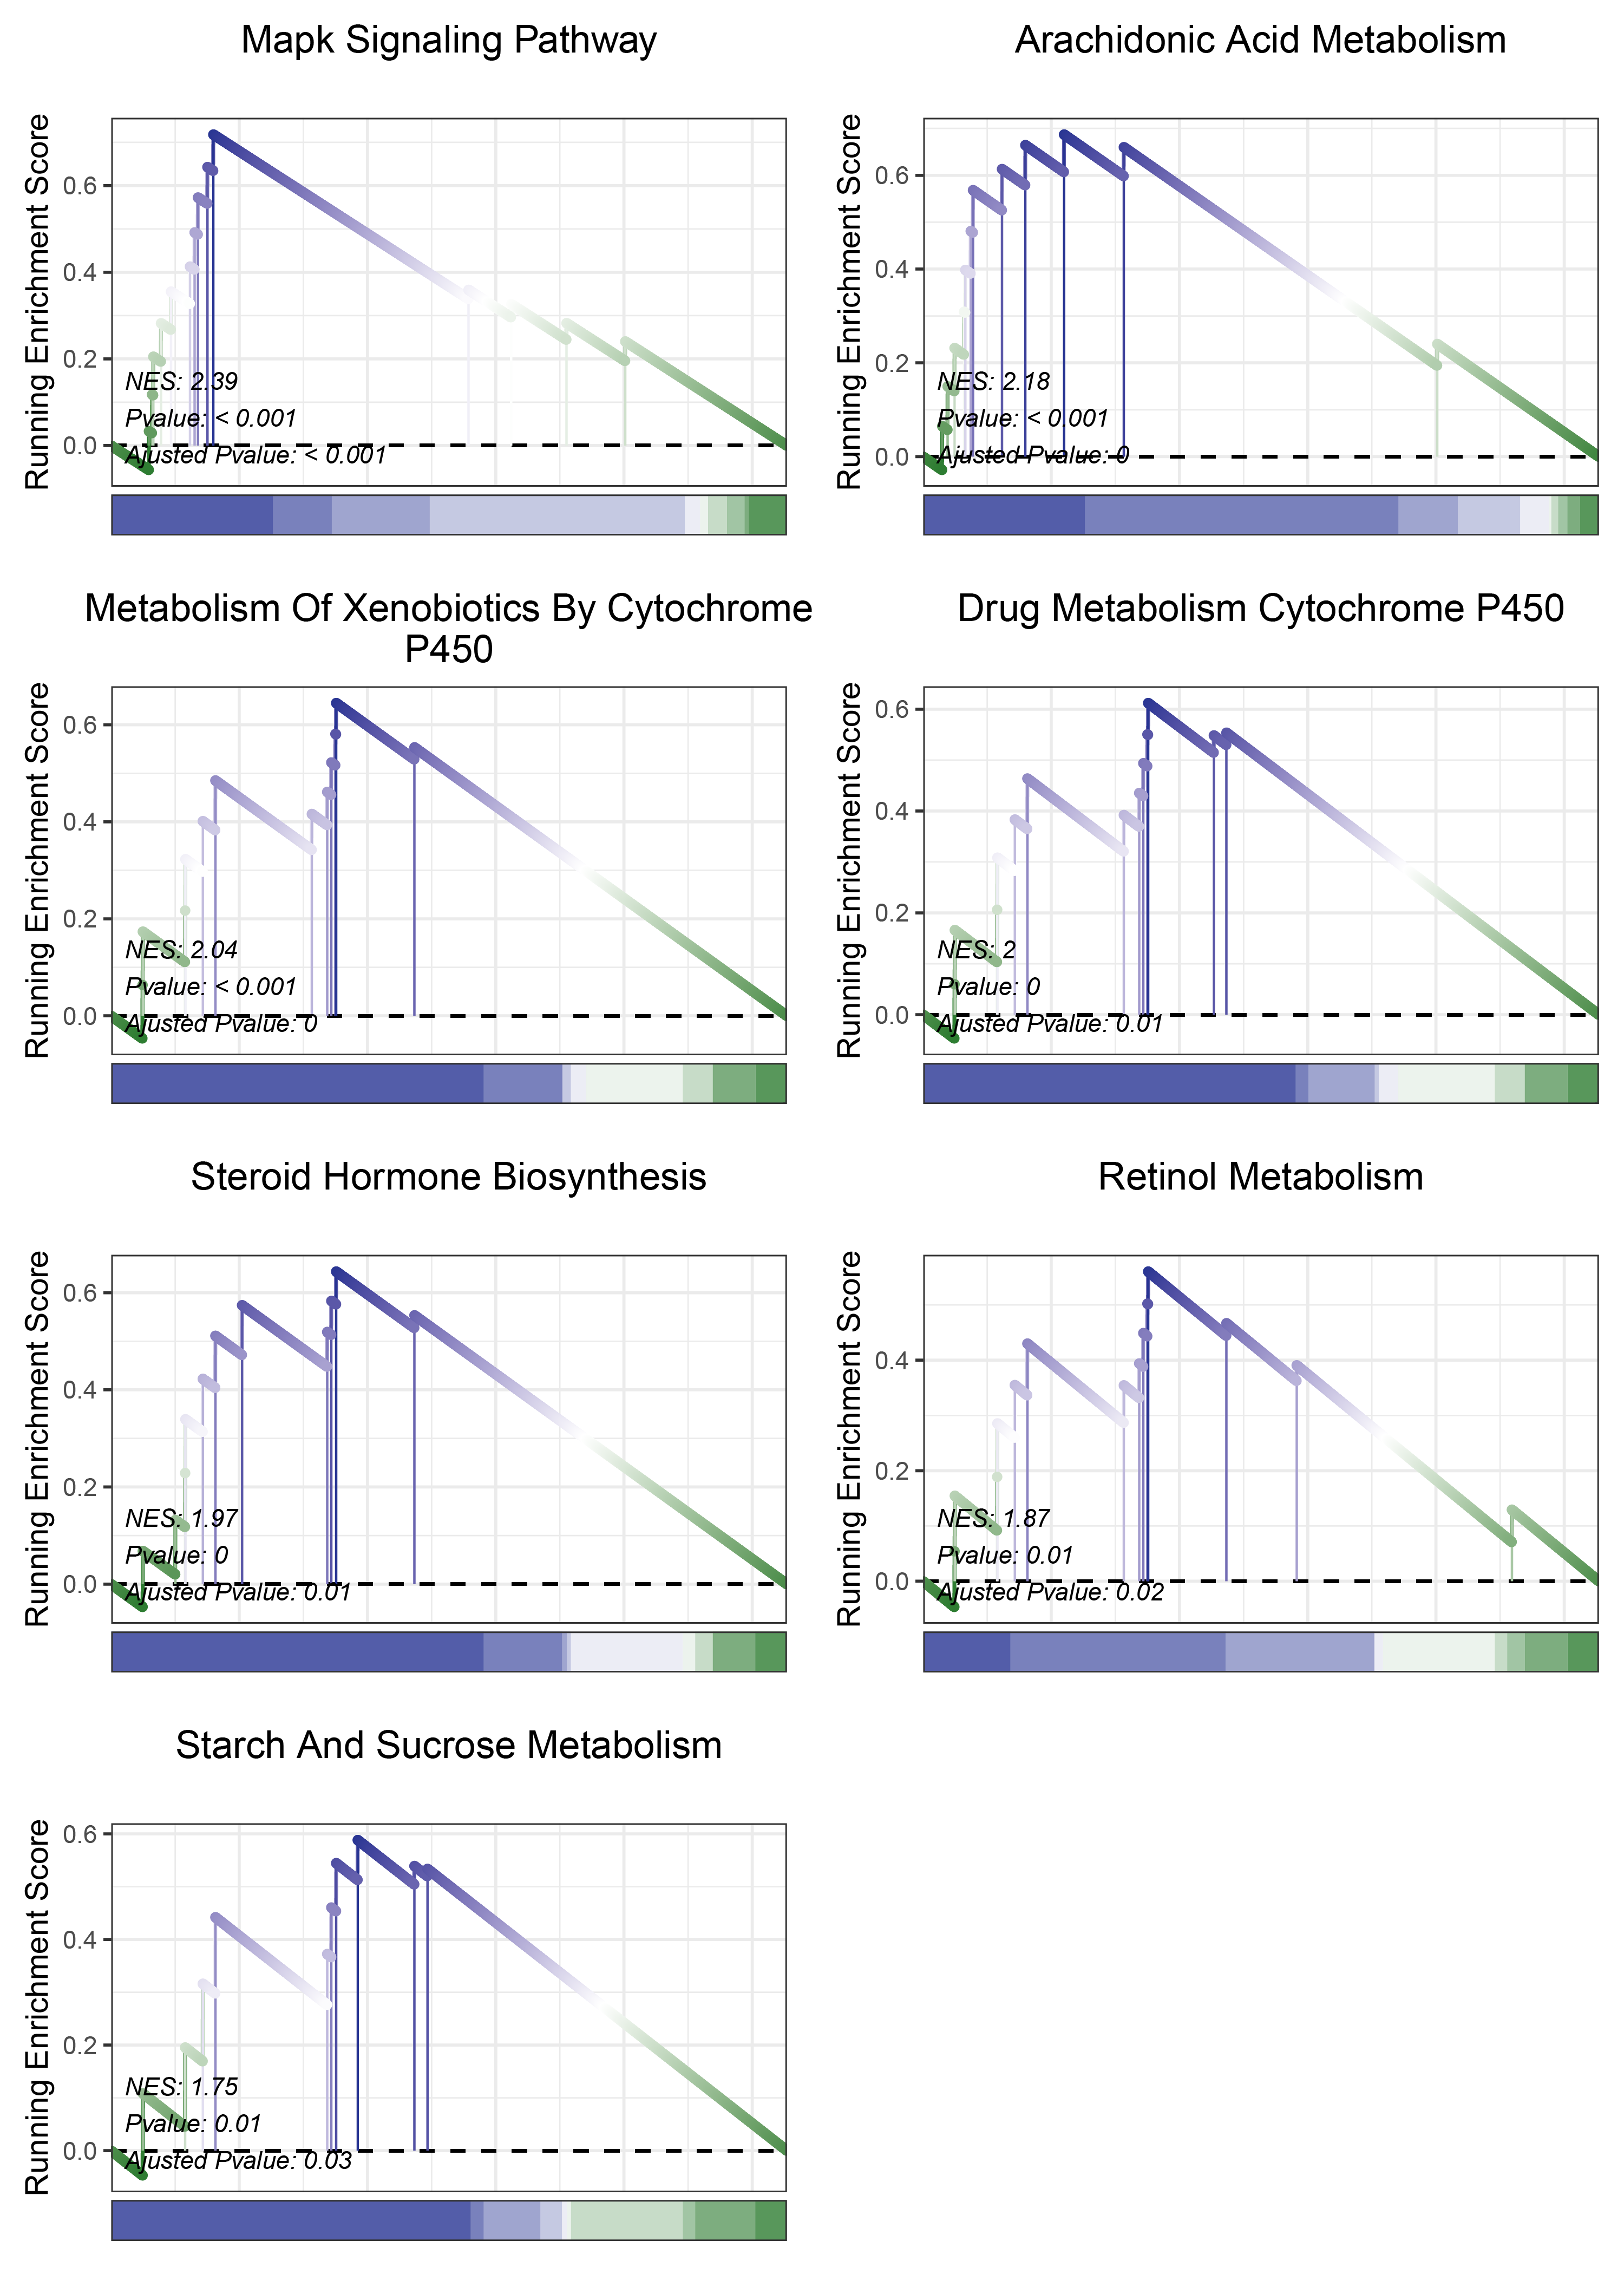
17.2.6 edgeR KEGG
print(edgeR_ANKRD35_kegg_y@result$ID)

# plot
geneSetID = c("Arachidonic Acid Metabolism",
                          "Mapk Signaling Pathway",
                          "Metabolism Of Xenobiotics By Cytochrome P450",
                          "Drug Metabolism Cytochrome P450",
                          "Steroid Hormone Biosynthesis",
                          "Starch And Sucrose Metabolism",
                          "Retinol Metabolism")

lapply(geneSetID, function(x){
  gseaNb(object = edgeR_ANKRD35_kegg_y,
          geneSetID = x,
          newGsea = T,
          addPval = T,
          pvalX = 0.02,pvalY = 0.1,
          pCol = 'black',
          pHjust = 0,
          subPlot = 2,newCurveCol = c("#2e7d32", "white", "#283593"),
          newHtCol = c("#283593", "white", "#2e7d32"))
}) -> gseaList1

# combine
cowplot::plot_grid(plotlist = gseaList1,ncol = 2,align = 'hv')
edgeR_ANKRD35_kegg
17.2.7 limma HALLMARKS
print(limma_ANKRD35_hallmarks_y@result$ID)

# plot
geneSetID = c("P53 Pathway",
                          "Estrogen Response Late",
                          "Estrogen Response Early",
                          "Apical Junction",
                          "Myogenesis",
                          "Kras Signaling Dn",
                          "Il2 Stat5 Signaling",
                          "Il6 Jak Stat3 Signaling",
                          "Interferon Alpha Response",
                          "Spermatogenesis",
                          "Complement",
                          "Inflammatory Response",
                          "Interferon Gamma Response",
                          "Allograft Rejection",
                          "E2f Targets",
                          "G2m Checkpoint")

lapply(geneSetID, function(x){
  gseaNb(object = limma_ANKRD35_hallmarks_y,
          geneSetID = x,
          newGsea = T,
          addPval = T,
          pvalX = 0.02,pvalY = 0.1,
          pCol = 'black',
          pHjust = 0,
          subPlot = 2,newCurveCol = c("#558b2f", "white", "#1565c0"),
          newHtCol = c("#1565c0", "white", "#558b2f"))
}) -> gseaList1

# combine
cowplot::plot_grid(plotlist = gseaList1,ncol = 2,align = 'hv')
limma_ANKRD35_hallmarks
17.2.8 limma KEGG
print(limma_ANKRD35_kegg_y@result$ID)

# plot
geneSetID = c("Gnrh Signaling Pathway",
                          "Metabolism Of Xenobiotics By Cytochrome P450",
                          "Steroid Hormone Biosynthesis",
                          "Linoleic Acid Metabolism",
                          "Drug Metabolism Cytochrome P450",
                          "Arachidonic Acid Metabolism",
                          "Natural Killer Cell Mediated Cytotoxicity",
                          "Viral Myocarditis",
                          "Cytokine Cytokine Receptor Interaction",
                          "Antigen Processing And Presentation",
                          "Cell Adhesion Molecules Cams",
                          "Toll Like Receptor Signaling Pathway",
                          "Primary Immunodeficiency",
                          "Leishmania Infection",
                          "Systemic Lupus Erythematosus",
                          "Chemokine Signaling Pathway",
                          "Hematopoietic Cell Lineage",
                          "Allograft Rejection",
                          "Graft Versus Host Disease",
                          "Autoimmune Thyroid Disease",
                          "Type I Diabetes Mellitus")

lapply(geneSetID, function(x){
  gseaNb(object = limma_ANKRD35_kegg_y,
          geneSetID = x,
          newGsea = T,
          addPval = T,
          pvalX = 0.02,pvalY = 0.1,
          pCol = 'black',
          pHjust = 0,
          subPlot = 2,newCurveCol = c("#558b2f", "white", "#1565c0"),
          newHtCol = c("#1565c0", "white", "#558b2f"))
}) -> gseaList1

# combine
cowplot::plot_grid(plotlist = gseaList1,ncol = 2,align = 'hv')
limma_ANKRD35_kegg
17.2.9 outRst HALLMARKS
print(outRst_ANKRD35_hallmarks_y@result$ID)

# plot
geneSetID = c("Estrogen Response Late",
                          "P53 Pathway",
                          "Apical Junction",
                          "Estrogen Response Early",
                          "Apoptosis",
                          "Il2 Stat5 Signaling",
                          "Inflammatory Response",
                          "Complement",
                          "Interferon Alpha Response",
                          "Il6 Jak Stat3 Signaling",
                          "Interferon Gamma Response",
                          "Allograft Rejection")

lapply(geneSetID, function(x){
  gseaNb(object = outRst_ANKRD35_hallmarks_y,
          geneSetID = x,
          newGsea = T,
          addPval = T,
          pvalX = 0.02,pvalY = 0.1,
          pCol = 'black',
          pHjust = 0,
          subPlot = 2,newCurveCol = c("#9e9d24", "white", "#0277bd"),
          newHtCol = c("#0277bd", "white", "#9e9d24"))
}) -> gseaList1

# combine
cowplot::plot_grid(plotlist = gseaList1,ncol = 2,align = 'hv')
outRst_ANKRD35_hallmarks
17.2.10 outRst KEGG
print(outRst_ANKRD35_kegg_y@result$ID)

# plot
geneSetID = c("Gnrh Signaling Pathway",
                          "Arachidonic Acid Metabolism",
                          "Mapk Signaling Pathway",
                          "Cytokine Cytokine Receptor Interaction",
                          "Viral Myocarditis",
                          "Leishmania Infection",
                          "Antigen Processing And Presentation",
                          "Toll Like Receptor Signaling Pathway",
                          "Cell Adhesion Molecules Cams",
                          "Natural Killer Cell Mediated Cytotoxicity",
                          "Hematopoietic Cell Lineage",
                          "Autoimmune Thyroid Disease",
                          "Systemic Lupus Erythematosus",
                          "Chemokine Signaling Pathway",
                          "Allograft Rejection",
                          "Graft Versus Host Disease",
                          "Type I Diabetes Mellitus")

lapply(geneSetID, function(x){
  gseaNb(object = outRst_ANKRD35_kegg_y,
          geneSetID = x,
          newGsea = T,
          addPval = T,
          pvalX = 0.02,pvalY = 0.1,
          pCol = 'black',
          pHjust = 0,
          subPlot = 2,newCurveCol = c("#9e9d24", "white", "#0277bd"),
          newHtCol = c("#0277bd", "white", "#9e9d24"))
}) -> gseaList1

# combine
cowplot::plot_grid(plotlist = gseaList1,ncol = 2,align = 'hv')
outRst_ANKRD35_kegg
17.3 ALOXE3
17.3.1 TransPropy HALLMARKS
print(TransPropy_ALOXE3_hallmarks_y@result$ID)

# plot
geneSetID = c("Kras Signaling Dn",
                          "Estrogen Response Early",
                          "Xenobiotic Metabolism",
                          "Apical Junction",
                          "Tnfa Signaling Via Nfkb",
                          "Epithelial Mesenchymal Transition",
                          "Spermatogenesis",
                          "Mitotic Spindle",
                          "E2f Targets",
                          "G2m Checkpoint")

lapply(geneSetID, function(x){
  gseaNb(object = TransPropy_ALOXE3_hallmarks_y,
          geneSetID = x,
          newGsea = T,
          addPval = T,
          pvalX = 0.02,pvalY = 0.1,
          pCol = 'black',
          pHjust = 0,
          subPlot = 2,newCurveCol = c("#00838f", "white", "#6a1b9a"),
          newHtCol = c("#6a1b9a", "white", "#00838f"))
}) -> gseaList1

# combine
cowplot::plot_grid(plotlist = gseaList1,ncol = 2,align = 'hv')![]()
TransPropy_ALOXE3_hallmarks
17.3.2 TransPropy KEGG
print(TransPropy_ALOXE3_kegg_y@result$ID)

# plot
geneSetID = c("Arachidonic Acid Metabolism",
                          "Endocytosis",
                          "Metabolism Of Xenobiotics By Cytochrome P450",
                          "Retinol Metabolism",
                          "Drug Metabolism Cytochrome P450",
                          "Ppar Signaling Pathway",
                          "Calcium Signaling Pathway",
                          "Vascular Smooth Muscle Contraction",
                          "Hematopoietic Cell Lineage",
                          "Cell Cycle")

lapply(geneSetID, function(x){
  gseaNb(object = TransPropy_ALOXE3_kegg_y,
          geneSetID = x,
          newGsea = T,
          addPval = T,
          pvalX = 0.02,pvalY = 0.1,
          pCol = 'black',
          pHjust = 0,
          subPlot = 2,newCurveCol = c("#00838f", "white", "#6a1b9a"),
          newHtCol = c("#6a1b9a", "white", "#00838f"))
}) -> gseaList1

# combine
cowplot::plot_grid(plotlist = gseaList1,ncol = 2,align = 'hv')
![]()
TransPropy_ALOXE3_kegg
17.3.3 deseq2 HALLMARKS
print(deseq2_ALOXE3_hallmarks_y@result$ID)

# plot
geneSetID = c("Estrogen Response Late",
                          "Apical Junction",
                          "Kras Signaling Dn",
                          "Estrogen Response Early",
                          "Hypoxia",
                          "P53 Pathway",
                          "Myogenesis",
                          "Kras Signaling Up",
                          "Allograft Rejection")

lapply(geneSetID, function(x){
  gseaNb(object = deseq2_ALOXE3_hallmarks_y,
          geneSetID = x,
          newGsea = T,
          addPval = T,
          pvalX = 0.02,pvalY = 0.1,
          pCol = 'black',
          pHjust = 0,
          subPlot = 2,newCurveCol = c("#00695c", "white", "#4527a0"),
          newHtCol = c("#4527a0", "white", "#00695c"))
}) -> gseaList1

# combine
cowplot::plot_grid(plotlist = gseaList1,ncol = 2,align = 'hv')
deseq2_ALOXE3_hallmarks
17.3.4 deseq2 KEGG
print(deseq2_ALOXE3_kegg_y@result$ID)

# plot
geneSetID = c("Mapk Signaling Pathway",
                          "Arachidonic Acid Metabolism",
                          "Metabolism Of Xenobiotics By Cytochrome P450",
                          "Linoleic Acid Metabolism",
                          "Steroid Hormone Biosynthesis",
                          "Gnrh Signaling Pathway",
                          "Drug Metabolism Cytochrome P450",
                          "Retinol Metabolism",
                          "Pathways In Cancer")

lapply(geneSetID, function(x){
  gseaNb(object = deseq2_ALOXE3_kegg_y,
          geneSetID = x,
          newGsea = T,
          addPval = T,
          pvalX = 0.02,pvalY = 0.1,
          pCol = 'black',
          pHjust = 0,
          subPlot = 2,newCurveCol = c("#00695c", "white", "#4527a0"),
          newHtCol = c("#4527a0", "white", "#00695c"))
}) -> gseaList1

# combine
cowplot::plot_grid(plotlist = gseaList1,ncol = 2,align = 'hv')
deseq2_ALOXE3_kegg
17.3.5 edgeR HALLMARKS
print(edgeR_ALOXE3_hallmarks_y@result$ID)

# plot
geneSetID = c("Apical Junction",
                          "Estrogen Response Late",
                          "Kras Signaling Dn",
                          "Estrogen Response Early")

lapply(geneSetID, function(x){
  gseaNb(object = edgeR_ALOXE3_hallmarks_y,
          geneSetID = x,
          newGsea = T,
          addPval = T,
          pvalX = 0.02,pvalY = 0.1,
          pCol = 'black',
          pHjust = 0,
          subPlot = 2,newCurveCol = c("#2e7d32", "white", "#283593"),
          newHtCol = c("#283593", "white", "#2e7d32"))
}) -> gseaList1

# combine
cowplot::plot_grid(plotlist = gseaList1,ncol = 2,align = 'hv')
edgeR_ALOXE3_hallmarks
17.3.6 edgeR KEGG
print(edgeR_ALOXE3_kegg_y@result$ID)

# plot
geneSetID = c("Mapk Signaling Pathway",
                          "Arachidonic Acid Metabolism",
                          "Metabolism Of Xenobiotics By Cytochrome P450",
                          "Drug Metabolism Cytochrome P450",
                          "Steroid Hormone Biosynthesis",
                          "Retinol Metabolism",
                          "Starch And Sucrose Metabolism")

lapply(geneSetID, function(x){
  gseaNb(object = edgeR_ALOXE3_kegg_y,
          geneSetID = x,
          newGsea = T,
          addPval = T,
          pvalX = 0.02,pvalY = 0.1,
          pCol = 'black',
          pHjust = 0,
          subPlot = 2,newCurveCol = c("#2e7d32", "white", "#283593"),
          newHtCol = c("#283593", "white", "#2e7d32"))
}) -> gseaList1

# combine
cowplot::plot_grid(plotlist = gseaList1,ncol = 2,align = 'hv')
edgeR_ALOXE3_kegg
17.3.7 limma HALLMARKS
print(limma_ALOXE3_hallmarks_y@result$ID)

# plot
geneSetID = c("P53 Pathway",
                          "Kras Signaling Dn",
                          "Estrogen Response Early",
                          "Estrogen Response Late",
                          "Apical Junction",
                          "Myogenesis",
                          "Complement",
                          "Epithelial Mesenchymal Transition",
                          "Interferon Alpha Response",
                          "Il6 Jak Stat3 Signaling",
                          "Inflammatory Response",
                          "Spermatogenesis",
                          "Allograft Rejection",
                          "Interferon Gamma Response",
                          "E2f Targets",
                          "G2m Checkpoint")

lapply(geneSetID, function(x){
  gseaNb(object = limma_ALOXE3_hallmarks_y,
          geneSetID = x,
          newGsea = T,
          addPval = T,
          pvalX = 0.02,pvalY = 0.1,
          pCol = 'black',
          pHjust = 0,
          subPlot = 2,newCurveCol = c("#558b2f", "white", "#1565c0"),
          newHtCol = c("#1565c0", "white", "#558b2f"))
}) -> gseaList1

# combine
cowplot::plot_grid(plotlist = gseaList1,ncol = 2,align = 'hv')
limma_ALOXE3_hallmarks
17.3.8 limma KEGG
print(limma_ALOXE3_kegg_y@result$ID)

# plot
geneSetID = c("Retinol Metabolism",
                          "Linoleic Acid Metabolism",
                          "Gnrh Signaling Pathway",
                          "Metabolism Of Xenobiotics By Cytochrome P450",
                          "Drug Metabolism Cytochrome P450",
                          "Arachidonic Acid Metabolism",
                          "Leishmania Infection",
                          "Systemic Lupus Erythematosus",
                          "Primary Immunodeficiency",
                          "Hematopoietic Cell Lineage",
                          "Allograft Rejection",
                          "Graft Versus Host Disease",
                          "Autoimmune Thyroid Disease",
                          "Type I Diabetes Mellitus")

lapply(geneSetID, function(x){
  gseaNb(object = limma_ALOXE3_kegg_y,
          geneSetID = x,
          newGsea = T,
          addPval = T,
          pvalX = 0.02,pvalY = 0.1,
          pCol = 'black',
          pHjust = 0,
          subPlot = 2,newCurveCol = c("#558b2f", "white", "#1565c0"),
          newHtCol = c("#1565c0", "white", "#558b2f"))
}) -> gseaList1

# combine
cowplot::plot_grid(plotlist = gseaList1,ncol = 2,align = 'hv')
limma_ALOXE3_kegg
17.3.9 outRst HALLMARKS
print(outRst_ALOXE3_hallmarks_y@result$ID)

# plot
geneSetID = c("Estrogen Response Late",
                          "P53 Pathway",
                          "Apical Junction",
                          "Estrogen Response Early",
                          "Kras Signaling Dn",
                          "Il2 Stat5 Signaling",
                          "Complement",
                          "Inflammatory Response",
                          "Interferon Alpha Response",
                          "Il6 Jak Stat3 Signaling",
                          "Interferon Gamma Response",
                          "Allograft Rejection")

lapply(geneSetID, function(x){
  gseaNb(object = outRst_ALOXE3_hallmarks_y,
          geneSetID = x,
          newGsea = T,
          addPval = T,
          pvalX = 0.02,pvalY = 0.1,
          pCol = 'black',
          pHjust = 0,
          subPlot = 2,newCurveCol = c("#9e9d24", "white", "#0277bd"),
          newHtCol = c("#0277bd", "white", "#9e9d24"))
}) -> gseaList1

# combine
cowplot::plot_grid(plotlist = gseaList1,ncol = 2,align = 'hv')
outRst_ALOXE3_hallmarks
17.3.10 outRst KEGG
print(outRst_ALOXE3_kegg_y@result$ID)

# plot
geneSetID = c("Arachidonic Acid Metabolism",
                          "Gnrh Signaling Pathway",
                          "Retinol Metabolism",
                          "Wnt Signaling Pathway",
                          "Long Term Depression",
                          "Mapk Signaling Pathway",
                          "Pathways In Cancer",
                          "Cell Adhesion Molecules Cams",
                          "Viral Myocarditis",
                          "Complement And Coagulation Cascades",
                          "Leishmania Infection",
                          "Antigen Processing And Presentation",
                          "Toll Like Receptor Signaling Pathway",
                          "Natural Killer Cell Mediated Cytotoxicity",
                          "Hematopoietic Cell Lineage",
                          "Autoimmune Thyroid Disease",
                          "Systemic Lupus Erythematosus",
                          "Chemokine Signaling Pathway",
                          "Allograft Rejection",
                          "Graft Versus Host Disease",
                          "Type I Diabetes Mellitus")

lapply(geneSetID, function(x){
  gseaNb(object = outRst_ALOXE3_kegg_y,
          geneSetID = x,
          newGsea = T,
          addPval = T,
          pvalX = 0.02,pvalY = 0.1,
          pCol = 'black',
          pHjust = 0,
          subPlot = 2,newCurveCol = c("#9e9d24", "white", "#0277bd"),
          newHtCol = c("#0277bd", "white", "#9e9d24"))
}) -> gseaList1

# combine
cowplot::plot_grid(plotlist = gseaList1,ncol = 2,align = 'hv')
outRst_ALOXE3_kegg
For detailed information on all pathways for each method, please refer to this section (scripts provided down to the individual gene level, such as 16.1.1.1).
Check if there are individual genes with highly significant differences that influence pathway-level results, creating the illusion of similarly significant activation or inhibition.