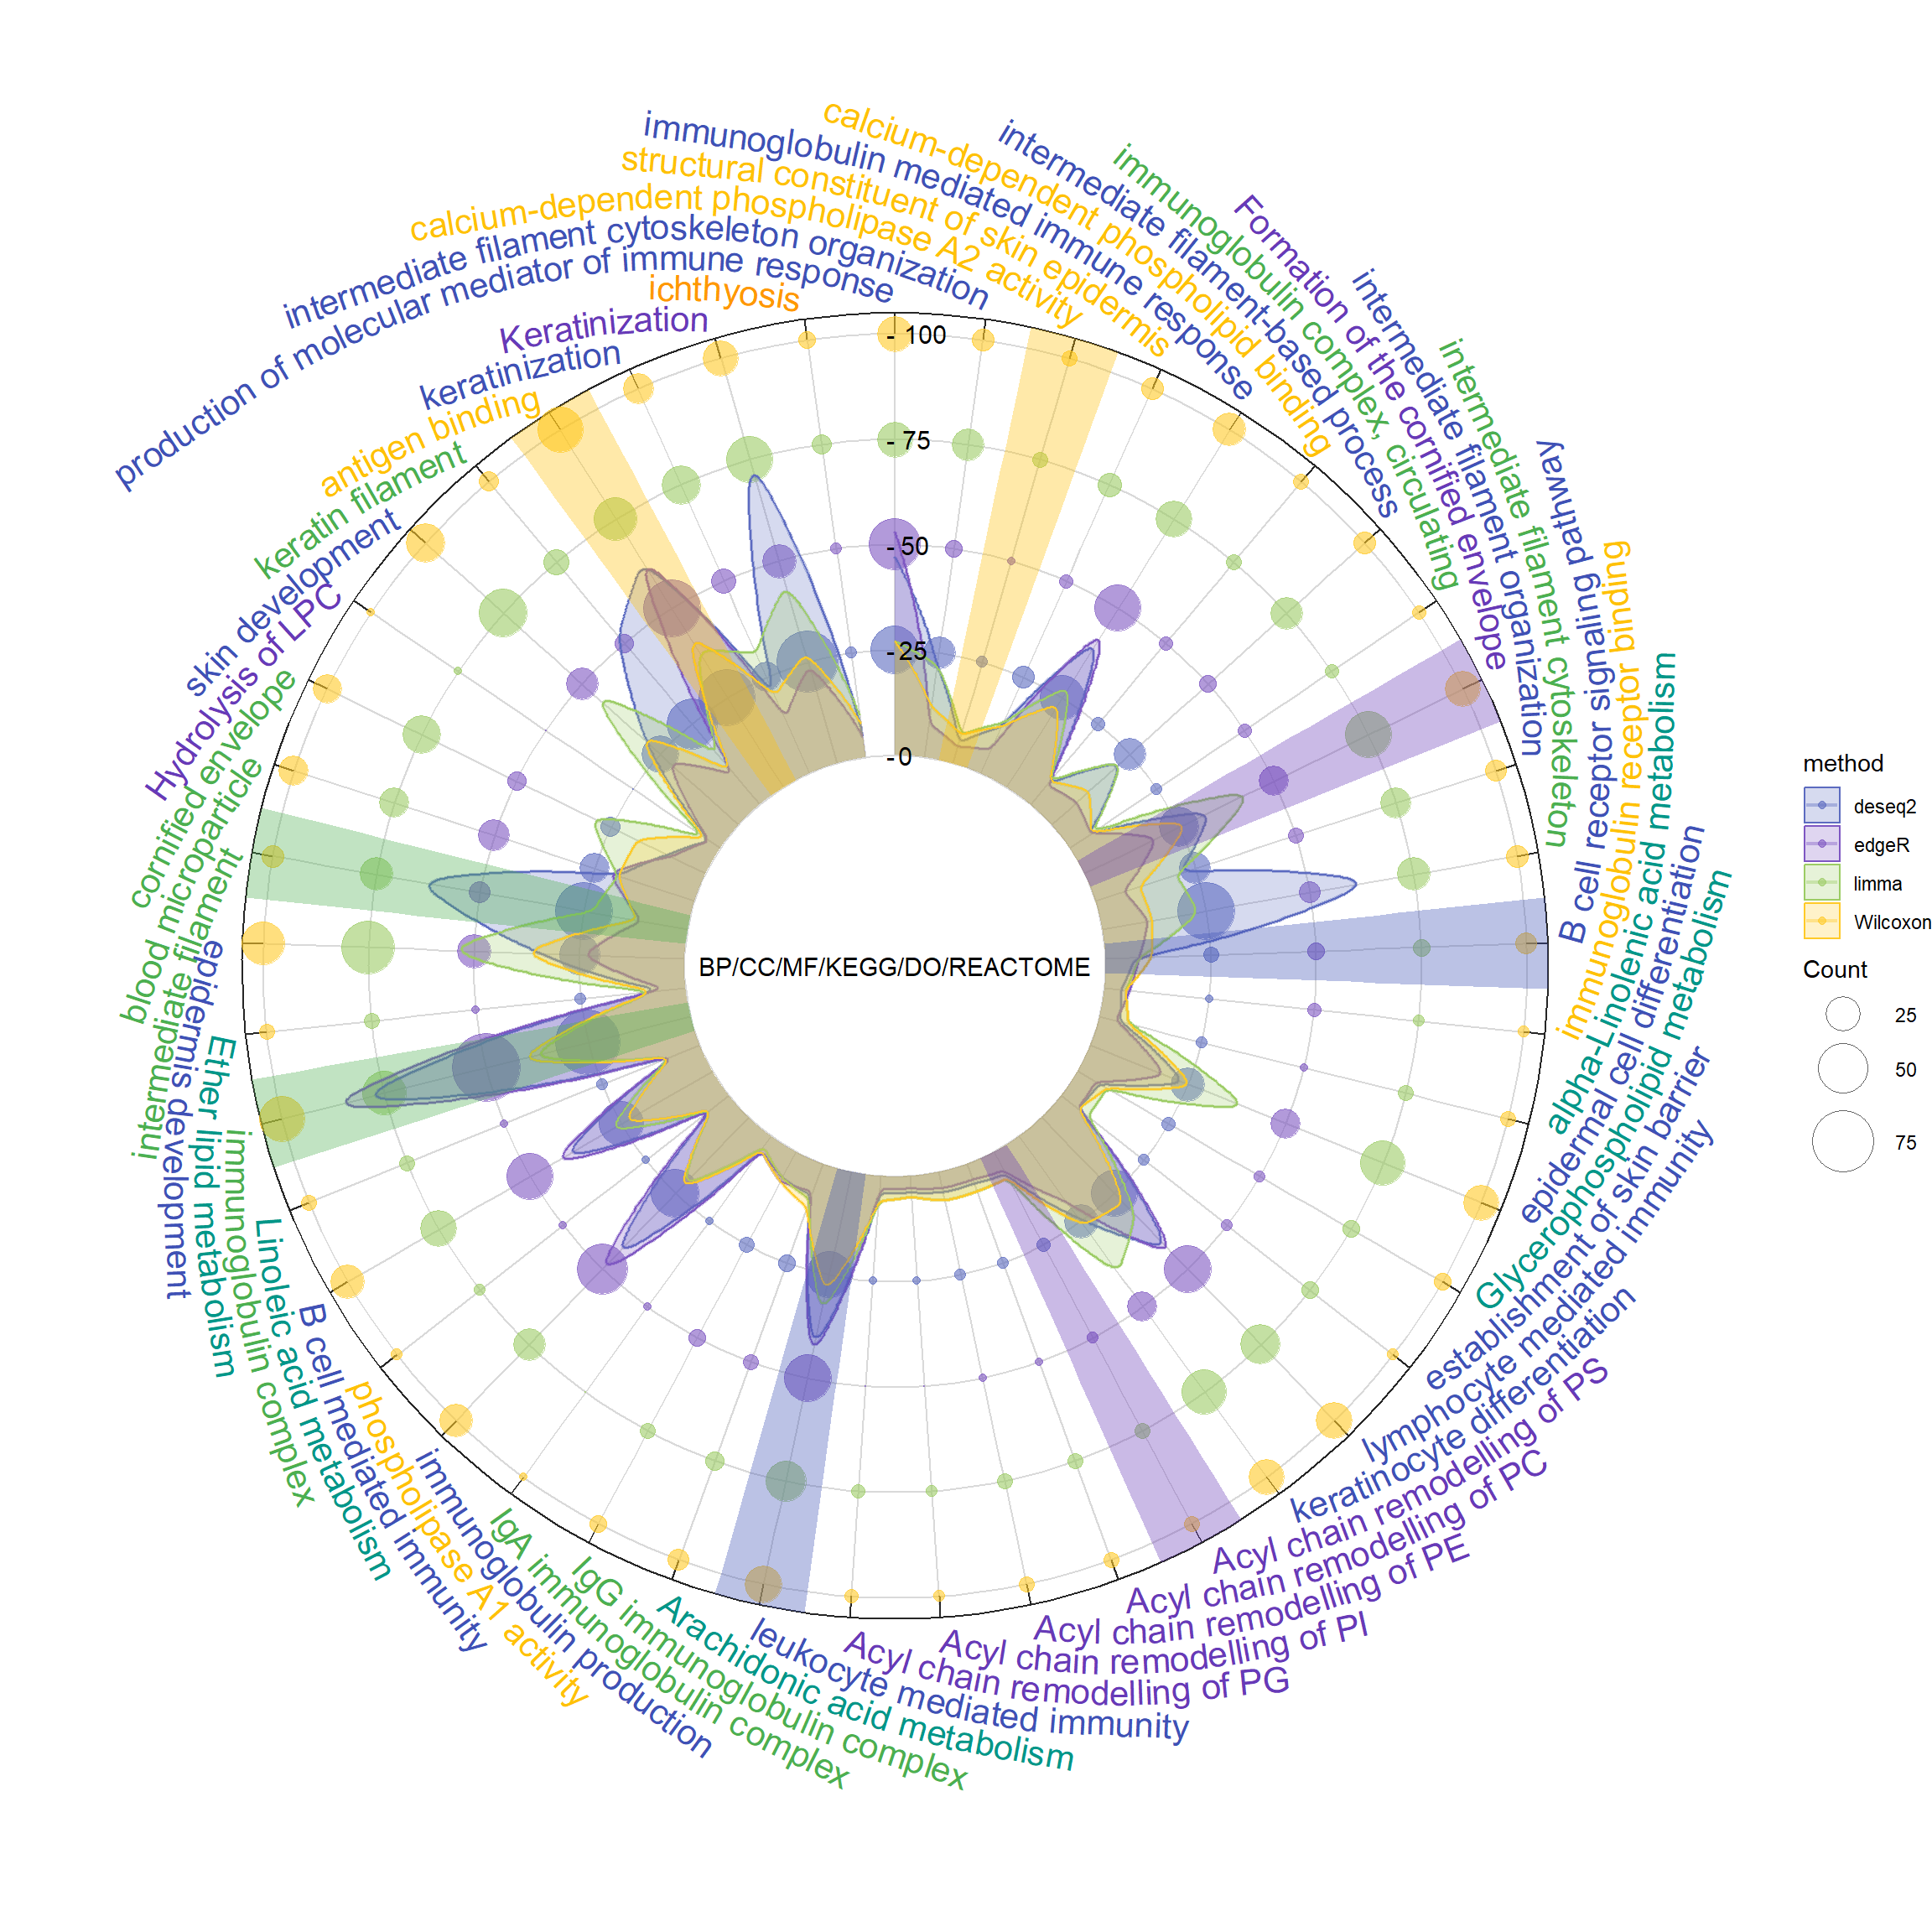
The analysis workflow initially employed four statistical methods: limma, DESeq2, edgeR, and Wilcoxon, to process six different types of bioinformatics enrichment analyses, including Biological Processes (BP), Cellular Components (CC), Molecular Functions (MF), KEGG Pathways, Disease Ontology (DO), and REACTOME Pathways.
Subsequently, detailed data visualization was conducted using ggplot2, which included using specific colors to highlight important IDs, displaying multilevel geometric figures (points, lines, and areas), and enhancing visual effects through polar coordinate transformation, making the results both intuitive and informative.
# Load the tumor and normal datasetstumor <-readRDS("../test_TransProR/generated_data1/removebatch_SKCM_Skin_TCGA_exp_tumor.rds")normal <-readRDS("../test_TransProR/generated_data1/removebatch_SKCM_Skin_Normal_TCGA_GTEX_count.rds")# Merge the datasets, ensuring that genes are used as row namesall_count_exp <-merge(tumor, normal, by ="row.names")all_count_exp <- tibble::column_to_rownames(all_count_exp, var ="Row.names") # Set the row names# Data transformation for plottingall_count_exp <-log_transform(all_count_exp)
# Conversion parameters defined to facilitate subsequent enrichment analysis:# fromType = "SYMBOL", toType = "ENTREZID"# This conversion is essential to avoid potential data loss due to non-one-to-one correspondence between symbols and ENTREZ IDs.# DEG_deseq2: Obtain a list of genesgene <-rownames(DEG_deseq2)# Convert gene symbols to ENTREZ IDsgene =bitr(gene, fromType="SYMBOL", toType="ENTREZID", OrgDb="org.Hs.eg.db")
'select()' returned 1:many mapping between keys and columns
Warning in bitr(gene, fromType = "SYMBOL", toType = "ENTREZID", OrgDb =
"org.Hs.eg.db"): 43.37% of input gene IDs are fail to map...
# Remove duplicates and mergegene <- dplyr::distinct(gene, SYMBOL, .keep_all=TRUE)# Extract the SYMBOL column from the first dataset as a vectorsymbols_vector <- gene$SYMBOL# Use the SYMBOL column as row names to filter corresponding rows in the second datasetDEG_deseq2 <- DEG_deseq2[rownames(DEG_deseq2) %in% symbols_vector, ]# DEG_edgeR: Obtain a list of genesgene <-rownames(DEG_edgeR)# Convert gene symbols to ENTREZ IDsgene =bitr(gene, fromType="SYMBOL", toType="ENTREZID", OrgDb="org.Hs.eg.db")
'select()' returned 1:many mapping between keys and columns
Warning in bitr(gene, fromType = "SYMBOL", toType = "ENTREZID", OrgDb =
"org.Hs.eg.db"): 27.35% of input gene IDs are fail to map...
# Remove duplicates and mergegene <- dplyr::distinct(gene, SYMBOL, .keep_all=TRUE)# Extract the SYMBOL column from the first dataset as a vectorsymbols_vector <- gene$SYMBOL# Use the SYMBOL column as row names to filter corresponding rows in the second datasetDEG_edgeR <- DEG_edgeR[rownames(DEG_edgeR) %in% symbols_vector, ]# DEG_limma_voom: Obtain a list of genesgene <-rownames(DEG_limma_voom)# Convert gene symbols to ENTREZ IDsgene =bitr(gene, fromType="SYMBOL", toType="ENTREZID", OrgDb="org.Hs.eg.db")
'select()' returned 1:many mapping between keys and columns
Warning in bitr(gene, fromType = "SYMBOL", toType = "ENTREZID", OrgDb =
"org.Hs.eg.db"): 19.69% of input gene IDs are fail to map...
# Remove duplicates and mergegene <- dplyr::distinct(gene, SYMBOL, .keep_all=TRUE)# Extract the SYMBOL column from the first dataset as a vectorsymbols_vector <- gene$SYMBOL# Use the SYMBOL column as row names to filter corresponding rows in the second datasetDEG_limma_voom <- DEG_limma_voom[rownames(DEG_limma_voom) %in% symbols_vector, ]# Wilcoxon Rank Sum Test Output# Obtain a list of genesgene <-rownames(Wilcoxon_rank_sum_testoutRst)# Convert gene symbols to ENTREZ IDsgene =bitr(gene, fromType="SYMBOL", toType="ENTREZID", OrgDb="org.Hs.eg.db")
'select()' returned 1:many mapping between keys and columns
Warning in bitr(gene, fromType = "SYMBOL", toType = "ENTREZID", OrgDb =
"org.Hs.eg.db"): 19.69% of input gene IDs are fail to map...
# Remove duplicates and mergegene <- dplyr::distinct(gene, SYMBOL, .keep_all=TRUE)# Extract the SYMBOL column from the first dataset as a vectorsymbols_vector <- gene$SYMBOL# Use the SYMBOL column as row names to filter corresponding rows in the second datasetWilcoxon_rank_sum_testoutRst <- Wilcoxon_rank_sum_testoutRst[rownames(Wilcoxon_rank_sum_testoutRst) %in% symbols_vector, ]
12.3 Select differentially expressed genes
# Select differentially expressed genesDiff_deseq2 <-filter_diff_genes(DEG_deseq2, p_val_col ="pvalue", log_fc_col ="log2FoldChange", p_val_threshold =0.01, log_fc_threshold =7)# First, get gene names as a list from the row names of the first datasetgene_names <-rownames(Diff_deseq2)# Find matching rows in the second dataframematched_rows <- all_count_exp[gene_names, ]# Calculate the average for each rowaverages <-rowMeans(matched_rows, na.rm =TRUE) # Append averages to the last column of the first dataframeDiff_deseq2$average <- averagesDiff_deseq2$ID <-rownames(Diff_deseq2)Diff_deseq2$changetype <-ifelse(Diff_deseq2$change =='up', 1, -1)# Define a small threshold valuesmall_value <- .Machine$double.xmin# Before computing -log10, replace zero values with the small threshold, then assign to a new columnDiff_deseq2$log_pvalue <-ifelse(Diff_deseq2$pvalue ==0, -log10(small_value), -log10(Diff_deseq2$pvalue))heatdata_deseq2 <- all_count_exp[rownames(Diff_deseq2),]Diff_edgeR <-filter_diff_genes(DEG_edgeR, p_val_col ="PValue", log_fc_col ="logFC", p_val_threshold =0.01, log_fc_threshold =7)# First, get gene names as a list from the row names of the first datasetgene_names <-rownames(Diff_edgeR)# Find matching rows in the second dataframematched_rows <- all_count_exp[gene_names, ]# Calculate the average for each rowaverages <-rowMeans(matched_rows, na.rm =TRUE) # Append averages to the last column of the first dataframeDiff_edgeR$average <- averagesDiff_edgeR$ID <-rownames(Diff_edgeR)Diff_edgeR$changetype <-ifelse(Diff_edgeR$change =='up', 1, -1)# Define a small threshold valuesmall_value <- .Machine$double.xmin# Before computing -log10, replace zero values with the small threshold, then assign to a new columnDiff_edgeR$log_pvalue <-ifelse(Diff_edgeR$PValue ==0, -log10(small_value), -log10(Diff_edgeR$PValue))heatdata_edgeR <- all_count_exp[rownames(Diff_edgeR),]Diff_limma_voom <-filter_diff_genes(DEG_limma_voom, p_val_col ="P.Value", log_fc_col ="logFC", p_val_threshold =0.01, log_fc_threshold =5.5)# First, get gene names as a list from the row names of the first datasetgene_names <-rownames(Diff_limma_voom)# Find matching rows in the second dataframematched_rows <- all_count_exp[gene_names, ]# Calculate the average for each rowaverages <-rowMeans(matched_rows, na.rm =TRUE) # Append averages to the last column of the first dataframeDiff_limma_voom$average <- averagesDiff_limma_voom$ID <-rownames(Diff_limma_voom)Diff_limma_voom$changetype <-ifelse(Diff_limma_voom$change =='up', 1, -1)# Define a small threshold valuesmall_value <- .Machine$double.xmin# Before computing -log10, replace zero values with the small threshold, then assign to a new columnDiff_limma_voom$log_pvalue <-ifelse(Diff_limma_voom$P.Value ==0, -log10(small_value), -log10(Diff_limma_voom$P.Value))heatdata_limma_voom <- all_count_exp[rownames(Diff_limma_voom),]Diff_Wilcoxon <-filter_diff_genes(Wilcoxon_rank_sum_testoutRst, p_val_col ="pValues", log_fc_col ="log2foldChange", p_val_threshold =0.01, log_fc_threshold =6)# First, get gene names as a list from the row names of the first datasetgene_names <-rownames(Diff_Wilcoxon)# Find matching rows in the second dataframematched_rows <- all_count_exp[gene_names, ]# Calculate the average for each rowaverages <-rowMeans(matched_rows, na.rm =TRUE) # Append averages to the last column of the first
12.4 Enrichment analysis for Diff_deseq2
###### Enrichment analysis for Diff_deseq2# Obtain a list of genesgene <-rownames(Diff_deseq2)## Convert symbols to ENTREZ IDsgene =bitr(gene, fromType="SYMBOL", toType="ENTREZID", OrgDb="org.Hs.eg.db")
'select()' returned 1:1 mapping between keys and columns
## Remove duplicates and mergegene <- dplyr::distinct(gene, SYMBOL, .keep_all=TRUE)gene_df <-data.frame(logFC=Diff_deseq2$log2FoldChange, SYMBOL =rownames(Diff_deseq2))gene_df <-merge(gene_df, gene, by="SYMBOL")GO_deseq2 <- gene_df$ENTREZID###### This file only requires a column with gene names#################### GO Analysis for Biological Process (BP)# Conduct gene enrichment analysiserich.go.BP_deseq2 <-enrichGO(gene = GO_deseq2,OrgDb = org.Hs.eg.db,keyType ="ENTREZID",ont ='BP', # Biological ProcesspvalueCutoff =0.05,qvalueCutoff =0.05,readable =TRUE)erich.go.BP.outdata_deseq2 <-as.data.frame(erich.go.BP_deseq2)summary(erich.go.BP.outdata_deseq2)
      ID            Description         GeneRatio           BgRatio
 Length:23          Length:23          Length:23          Length:23
 Class :character   Class :character   Class :character   Class :character
 Mode  :character   Mode  :character   Mode  :character   Mode  :character


     pvalue             p.adjust            qvalue            geneID
 Min.   :0.000e+00   Min.   :0.000000   Min.   :0.000000   Length:23
 1st Qu.:0.000e+00   1st Qu.:0.000000   1st Qu.:0.000000   Class :character
 Median :0.000e+00   Median :0.000000   Median :0.000000   Mode  :character
 Mean   :6.230e-05   Mean   :0.005689   Mean   :0.005633
 3rd Qu.:2.733e-05   3rd Qu.:0.002994   3rd Qu.:0.002965
 Max.   :4.446e-04   Max.   :0.037466   Max.   :0.037097
     Count
 Min.   : 4.00
 1st Qu.: 9.50
 Median :22.00
 Mean   :24.22
 3rd Qu.:41.00
 Max.   :47.00
kegg.out.outdata_deseq2 <-as.data.frame(kegg.out_deseq2)# Convert ENTREZ gene IDs or Ensembl gene IDs to symbolskegg.out1_deseq2 =as.data.frame(kegg.out_deseq2)ENTREZID =strsplit(kegg.out1_deseq2$geneID, "/")symbol =sapply(ENTREZID, function(x) { y =bitr(x, fromType="ENTREZID", toType="SYMBOL", OrgDb="org.Hs.eg.db")# For many-to-one mappings, pick the first one y = y[!duplicated(y$ENTREZID), -1] y =paste(y, collapse ="/")})
'select()' returned 1:1 mapping between keys and columns
'select()' returned 1:1 mapping between keys and columns
'select()' returned 1:1 mapping between keys and columns
'select()' returned 1:1 mapping between keys and columns
'select()' returned 1:1 mapping between keys and columns
'select()' returned 1:1 mapping between keys and columns
'select()' returned 1:1 mapping between keys and columns
'select()' returned 1:1 mapping between keys and columns
'select()' returned 1:1 mapping between keys and columns
'select()' returned 1:1 mapping between keys and columns
'select()' returned 1:1 mapping between keys and columns
'select()' returned 1:1 mapping between keys and columns
'select()' returned 1:1 mapping between keys and columns
'select()' returned 1:1 mapping between keys and columns
'select()' returned 1:1 mapping between keys and columns
'select()' returned 1:1 mapping between keys and columns
###### Enrichment analysis for Diff_edgeR# Obtain a list of genesgene <-rownames(Diff_edgeR)## Convert symbols to ENTREZ IDsgene =bitr(gene, fromType="SYMBOL", toType="ENTREZID", OrgDb="org.Hs.eg.db")
'select()' returned 1:1 mapping between keys and columns
## Remove duplicates and mergegene <- dplyr::distinct(gene, SYMBOL, .keep_all=TRUE)gene_df <-data.frame(logFC=Diff_edgeR$logFC, SYMBOL =rownames(Diff_edgeR))gene_df <-merge(gene_df, gene, by="SYMBOL")GO_edgeR <- gene_df$ENTREZID###### This file only requires a column with gene names#################### GO Analysis for Biological Process (BP)# Conduct gene enrichment analysiserich.go.BP_edgeR <-enrichGO(gene = GO_edgeR,OrgDb = org.Hs.eg.db,keyType ="ENTREZID",ont ='BP', # Biological ProcesspvalueCutoff =0.05,qvalueCutoff =0.05,readable =TRUE)erich.go.BP.outdata_edgeR <-as.data.frame(erich.go.BP_edgeR)#write.csv(erich.go.BP.outdata, "E:/fruit/erich.go.BP.outdata.csv")# GO Analysis for Molecular Function (MF)# Conduct gene enrichment analysiserich.go.MF_edgeR <-enrichGO(gene = GO_edgeR,OrgDb = org.Hs.eg.db,keyType ="ENTREZID",ont ='MF', # Molecular FunctionpvalueCutoff =0.05,qvalueCutoff =0.05,readable =TRUE)erich.go.MF.outdata_edgeR <-as.data.frame(erich.go.MF_edgeR)#write.csv(erich.go.MF.outdata, "E:/fruit/erich.go.MF.outdata.csv")# GO Analysis for Cellular Component (CC)# Conduct gene enrichment analysiserich.go.CC_edgeR <-enrichGO(gene = GO_edgeR,OrgDb = org.Hs.eg.db,keyType ="ENTREZID",ont ='CC', # Cellular ComponentpvalueCutoff =0.05,qvalueCutoff =0.05,readable =TRUE)erich.go.CC.outdata_edgeR <-as.data.frame(erich.go.CC_edgeR)#write.csv(erich.go.CC.outdata, "E:/fruit/erich.go.CC.outdata.csv")#### KEGG Analysis ###kegg.out_edgeR <-enrichKEGG(gene = GO_edgeR,organism ="hsa",keyType ="kegg",pvalueCutoff =0.05,pAdjustMethod ="BH",qvalueCutoff =0.05)kegg.out.outdata_edgeR <-as.data.frame(kegg.out_edgeR)# Convert ENTREZ gene IDs or Ensembl gene IDs to symbolslibrary(org.Hs.eg.db)kegg.out1_edgeR =as.data.frame(kegg.out_edgeR)ENTREZID =strsplit(kegg.out1_edgeR$geneID, "/")symbol =sapply(ENTREZID, function(x) { y =bitr(x, fromType="ENTREZID", toType="SYMBOL", OrgDb="org.Hs.eg.db")# For many-to-one mappings, pick the first y = y[!duplicated(y$ENTREZID), -1] y =paste(y, collapse ="/")})
'select()' returned 1:1 mapping between keys and columns
'select()' returned 1:1 mapping between keys and columns
'select()' returned 1:1 mapping between keys and columns
'select()' returned 1:1 mapping between keys and columns
'select()' returned 1:1 mapping between keys and columns
'select()' returned 1:1 mapping between keys and columns
'select()' returned 1:1 mapping between keys and columns
'select()' returned 1:1 mapping between keys and columns
'select()' returned 1:1 mapping between keys and columns
'select()' returned 1:1 mapping between keys and columns
###### Enrichment analysis for Diff_limma_voom# Obtain a list of genesgene <-rownames(Diff_limma_voom)## Convert symbols to ENTREZ IDsgene =bitr(gene, fromType="SYMBOL", toType="ENTREZID", OrgDb="org.Hs.eg.db")
'select()' returned 1:1 mapping between keys and columns
## Remove duplicates and mergegene <- dplyr::distinct(gene, SYMBOL, .keep_all=TRUE)gene_df <-data.frame(logFC=Diff_limma_voom$logFC, SYMBOL =rownames(Diff_limma_voom))gene_df <-merge(gene_df, gene, by="SYMBOL")GO_limma <- gene_df$ENTREZID###### This file only requires a column with gene names#################### GO Analysis for Biological Process (BP)# Conduct gene enrichment analysiserich.go.BP_limma <-enrichGO(gene = GO_limma,OrgDb = org.Hs.eg.db,keyType ="ENTREZID",ont ='BP', # Biological ProcesspvalueCutoff =0.05,qvalueCutoff =0.05,readable =TRUE)erich.go.BP.outdata_limma <-as.data.frame(erich.go.BP_limma)#write.csv(erich.go.BP.outdata, "E:/fruit/erich.go.BP.outdata.csv")# GO Analysis for Molecular Function (MF)# Conduct gene enrichment analysiserich.go.MF_limma <-enrichGO(gene = GO_limma,OrgDb = org.Hs.eg.db,keyType ="ENTREZID",ont ='MF', # Molecular FunctionpvalueCutoff =0.05,qvalueCutoff =0.05,readable =TRUE)erich.go.MF.outdata_limma <-as.data.frame(erich.go.MF_limma)#write.csv(erich.go.MF.outdata, "E:/fruit/erich.go.MF.outdata.csv")# GO Analysis for Cellular Component (CC)# Conduct gene enrichment analysiserich.go.CC_limma <-enrichGO(gene = GO_limma,OrgDb = org.Hs.eg.db,keyType ="ENTREZID",ont ='CC', # Cellular ComponentpvalueCutoff =0.05,qvalueCutoff =0.05,readable =TRUE)erich.go.CC.outdata_limma <-as.data.frame(erich.go.CC_limma)#write.csv(erich.go.CC.outdata, "E:/fruit/erich.go.CC.outdata.csv")#### KEGG Analysis ###kegg.out_limma <-enrichKEGG(gene = GO_limma,organism ="hsa",keyType ="kegg",pvalueCutoff =0.05,pAdjustMethod ="BH",qvalueCutoff =0.05)kegg.out.outdata_limma <-as.data.frame(kegg.out_limma)# Convert ENTREZ gene IDs or Ensembl gene IDs to symbolslibrary(org.Hs.eg.db)kegg.out1_limma =as.data.frame(kegg.out_limma)ENTREZID =strsplit(kegg.out1_limma$geneID, "/")symbol =sapply(ENTREZID, function(x) { y =bitr(x, fromType="ENTREZID", toType="SYMBOL", OrgDb="org.Hs.eg.db")# For many-to-one mappings, pick the first y = y[!duplicated(y$ENTREZID), -1] y =paste(y, collapse ="/")})
'select()' returned 1:1 mapping between keys and columns
'select()' returned 1:1 mapping between keys and columns
'select()' returned 1:1 mapping between keys and columns
'select()' returned 1:1 mapping between keys and columns
'select()' returned 1:1 mapping between keys and columns
'select()' returned 1:1 mapping between keys and columns
'select()' returned 1:1 mapping between keys and columns
'select()' returned 1:1 mapping between keys and columns
'select()' returned 1:1 mapping between keys and columns
'select()' returned 1:1 mapping between keys and columns
'select()' returned 1:1 mapping between keys and columns
'select()' returned 1:1 mapping between keys and columns
'select()' returned 1:1 mapping between keys and columns
'select()' returned 1:1 mapping between keys and columns
'select()' returned 1:1 mapping between keys and columns
'select()' returned 1:1 mapping between keys and columns
'select()' returned 1:1 mapping between keys and columns
###### Enrichment analysis for Diff_Wilcoxon# Obtain a list of genesgene <-rownames(Diff_Wilcoxon)## Convert symbols to ENTREZ IDsgene =bitr(gene, fromType="SYMBOL", toType="ENTREZID", OrgDb="org.Hs.eg.db")
'select()' returned 1:1 mapping between keys and columns
## Remove duplicates and mergegene <- dplyr::distinct(gene, SYMBOL, .keep_all=TRUE)gene_df <-data.frame(logFC=Diff_Wilcoxon$log2foldChange, SYMBOL =rownames(Diff_Wilcoxon))gene_df <-merge(gene_df, gene, by="SYMBOL")GO_Wilcoxon <- gene_df$ENTREZID###### This file only requires a column with gene names#################### GO Analysis for Biological Process (BP)# Conduct gene enrichment analysiserich.go.BP_Wilcoxon <-enrichGO(gene = GO_Wilcoxon,OrgDb = org.Hs.eg.db,keyType ="ENTREZID",ont ='BP', # Biological ProcesspvalueCutoff =0.05,qvalueCutoff =0.05,readable =TRUE)erich.go.BP.outdata_Wilcoxon <-as.data.frame(erich.go.BP_Wilcoxon)#write.csv(erich.go.BP.outdata, "E:/fruit/erich.go.BP.outdata.csv")# GO Analysis for Molecular Function (MF)# Conduct gene enrichment analysiserich.go.MF_Wilcoxon <-enrichGO(gene = GO_Wilcoxon,OrgDb = org.Hs.eg.db,keyType ="ENTREZID",ont ='MF', # Molecular FunctionpvalueCutoff =0.05,qvalueCutoff =0.05,readable =TRUE)erich.go.MF.outdata_Wilcoxon <-as.data.frame(erich.go.MF_Wilcoxon)#write.csv(erich.go.MF.outdata, "E:/fruit/erich.go.MF.outdata.csv")# GO Analysis for Cellular Component (CC)# Conduct gene enrichment analysiserich.go.CC_Wilcoxon <-enrichGO(gene = GO_Wilcoxon,OrgDb = org.Hs.eg.db,keyType ="ENTREZID",ont ='CC', # Cellular ComponentpvalueCutoff =0.05,qvalueCutoff =0.05,readable =TRUE)erich.go.CC.outdata_Wilcoxon <-as.data.frame(erich.go.CC_Wilcoxon)#write.csv(erich.go.CC.outdata, "E:/fruit/erich.go.CC.outdata.csv")#### KEGG Analysis ###kegg.out_Wilcoxon <-enrichKEGG(gene = GO_Wilcoxon,organism ="hsa",keyType ="kegg",pvalueCutoff =0.05,pAdjustMethod ="BH",qvalueCutoff =0.05)kegg.out.outdata_Wilcoxon <-as.data.frame(kegg.out_Wilcoxon)# Convert ENTREZ gene IDs or Ensembl gene IDs to symbolslibrary(org.Hs.eg.db)kegg.out1_Wilcoxon =as.data.frame(kegg.out_Wilcoxon)ENTREZID =strsplit(kegg.out1_Wilcoxon$geneID, "/")symbol =sapply(ENTREZID, function(x) { y =bitr(x, fromType="ENTREZID", toType="SYMBOL", OrgDb="org.Hs.eg.db")# For many-to-one mappings, pick the first y = y[!duplicated(y$ENTREZID), -1] y =paste(y, collapse ="/")})
'select()' returned 1:1 mapping between keys and columns
'select()' returned 1:1 mapping between keys and columns
'select()' returned 1:1 mapping between keys and columns
'select()' returned 1:1 mapping between keys and columns
'select()' returned 1:1 mapping between keys and columns
'select()' returned 1:1 mapping between keys and columns
'select()' returned 1:1 mapping between keys and columns
'select()' returned 1:1 mapping between keys and columns
'select()' returned 1:1 mapping between keys and columns
'select()' returned 1:1 mapping between keys and columns
'select()' returned 1:1 mapping between keys and columns
'select()' returned 1:1 mapping between keys and columns
'select()' returned 1:1 mapping between keys and columns
'select()' returned 1:1 mapping between keys and columns
'select()' returned 1:1 mapping between keys and columns
# Define list of data framesdf_list <-list( erich.go.BP.outdata_deseq2, erich.go.MF.outdata_deseq2, erich.go.CC.outdata_deseq2, kegg.out1.outdata_deseq2, erich.go.DO.outdata_deseq2, erich.go.Reactome.outdata_deseq2)# Method name, assuming all "method" columns should have the same namemethod_name <-"deseq2"# Call function to merge data frames#combined_df_deseq2 <- merge_dataframes_with_same_method(df_list, method_name)color_list <-c("#3f51b5", "#ffc107", "#4caf50", "#009688", "#ff9800", "#673ab7") # Color values corresponding to df_list#combined_df <- merge_dataframes_with_same_method_and_color(df_list, method_name, color_list)combined_df_deseq2 <-merge_method_color(df_list, method_name, color_list)# Define list of data framesdf_list <-list( erich.go.BP.outdata_edgeR, erich.go.MF.outdata_edgeR, erich.go.CC.outdata_edgeR, kegg.out1.outdata_edgeR, erich.go.DO.outdata_edgeR, erich.go.Reactome.outdata_edgeR)# Method name, assuming all "method" columns should have the same namemethod_name <-"edgeR"color_list <-c("#3f51b5", "#ffc107", "#4caf50", "#009688", "#ff9800", "#673ab7")# Call function to merge data frames#combined_df_edgeR <- merge_dataframes_with_same_method(df_list, method_name)combined_df_edgeR <-merge_method_color(df_list, method_name, color_list)# Define list of data framesdf_list <-list( erich.go.BP.outdata_limma, erich.go.MF.outdata_limma, erich.go.CC.outdata_limma, kegg.out1.outdata_limma, erich.go.DO.outdata_limma, erich.go.Reactome.outdata_limma)# Method name, assuming all "method" columns should have the same namemethod_name <-"limma"color_list <-c("#3f51b5", "#ffc107", "#4caf50", "#009688", "#ff9800", "#673ab7")# Call function to merge data frames#combined_df_limma <- merge_dataframes_with_same_method(df_list, method_name)combined_df_limma <-merge_method_color(df_list, method_name, color_list)# Define list of data framesdf_list <-list( erich.go.BP.outdata_Wilcoxon, erich.go.MF.outdata_Wilcoxon, erich.go.CC.outdata_Wilcoxon, kegg.out1.outdata_Wilcoxon, erich.go.DO.outdata_Wilcoxon, erich.go.Reactome.outdata_Wilcoxon)# Method name, assuming all "method" columns should have the same namemethod_name <-"Wilcoxon"color_list <-c("#3f51b5", "#ffc107", "#4caf50", "#009688", "#ff9800", "#673ab7")# Call function to merge data frames#combined_df_Wilcoxon <- merge_dataframes_with_same_method(df_list, method_name)combined_df_Wilcoxon <-merge_method_color(df_list, method_name, color_list)
# Use this function to merge four different data frames that have common row names and add an id column to each data framedf_list <-list( combined_df_deseq2, combined_df_edgeR, combined_df_limma, combined_df_Wilcoxon)# Define a function to count the number of words in a descriptioncount_words <-function(description) {length(strsplit(description, "\\s+")[[1]])}# Define a function to filter the data frame so that it only includes rows with no more than 8 wordsfilter_descriptions <-function(df) { df %>%filter(sapply(Description, count_words) <=8)}# Apply this function to each data frame in the listfiltered_df_list <-lapply(df_list, filter_descriptions)summary(filtered_df_list)
     Length Class      Mode
[1,] 4      data.frame list
[2,] 4      data.frame list
[3,] 4      data.frame list
[4,] 4      data.frame list